Data visualization in the healthcare industry is no longer an option—it’s a must-have for modern medical organizations. The global market of healthcare data analytics is estimated to grow 3.5 times in just six years, from $11.5 billion in 2019 to $40.8 billion in 2025. Meanwhile, more than half of the healthcare organizations worldwide name data integration as the first technology they plan to adopt by the end of 2021.
While many factors influence the boom in data analytics and visualization tools, the most recent and obvious one is the pandemic. The COVID-19 outbreak drove the health tech adoption, which naturally increased the volumes of data available in digital format. To bring relevant information into focus, healthcare organizations implement tools for data integration and visualization.
At Demigos, we specialize in developing custom health tech solutions. Years of hands-on experience and dozens of completed projects show us that data visualization can greatly improve patient care and save providers lots of costs.
Read also: How to Improve Data Quality in Healthcare
In this article, we'll discuss how the visualization of data helps healthcare organizations become more effective. We’ll also give you some examples of the way healthcare visualization is used in the medical sector, and mention several leading tools which are now available.
Data visualization in healthcare

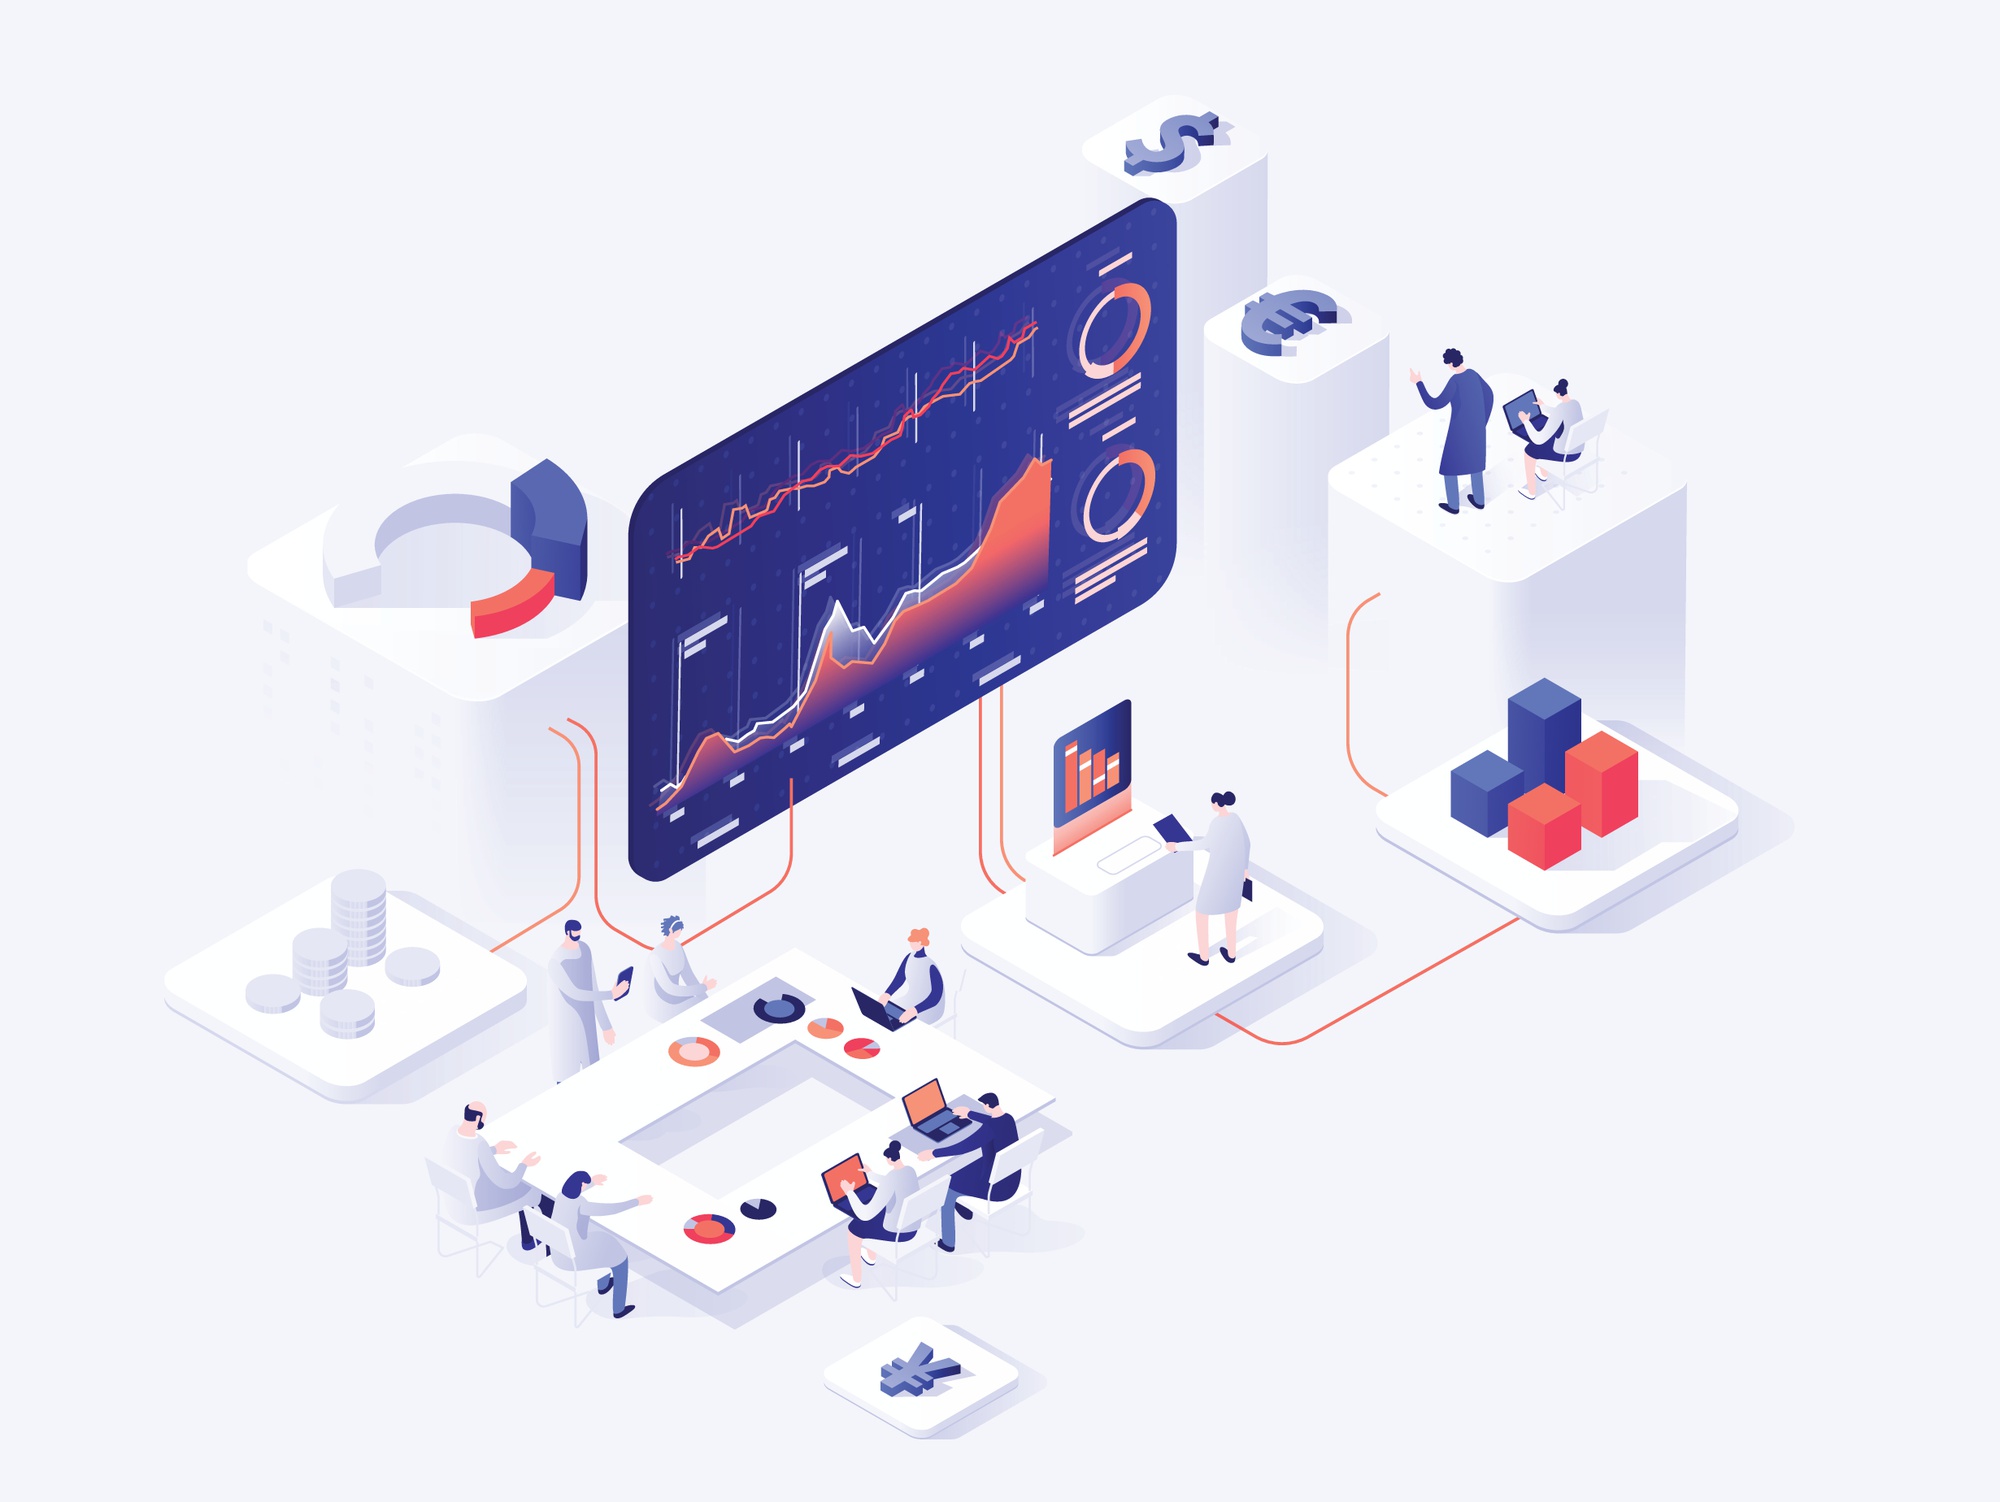
So what is health data visualization? In brief, it’s a process of unifying diverse medical data coming from various sources and transforming it into visual content (infographics and mini-infographics, charts, tables, timelines, scatter plots, or others). The primary purpose of visualization is to help medical staff interpret data analytics results faster, recognize trends, and make better decisions.
Read also: Data Analytics in Claims Processing
Today's healthcare systems collect and track mountains of information around the clock. Data comes from many sources, including EHRs/EMRs, disease registers, remote monitoring devices, hospital management systems, billing and coding software, and more. Along with this, healthcare organizations deal with data from diagnostic centers, laboratories, pharmaceutical companies, and dozens if not hundreds of IoT devices in the hospital itself.
Read also: Pharmaceutical Software Development Guide
But access to huge amounts of data is of little value without data visualization that helps medical staff find required information faster, resulting in a more effective decision-making process.
Visualization tools have become essential for the industry, but before we dive into the reasons, let’s first explore examples of data visualization in healthcare.
How is data visualization used in healthcare?
Modern data visualization tools in healthcare convert complex data into user-friendly visuals that are easy to understand for its stakeholders, be they doctors, patients, or government officers. Below, we’ll define the primary types of visuals now used in the medical industry.
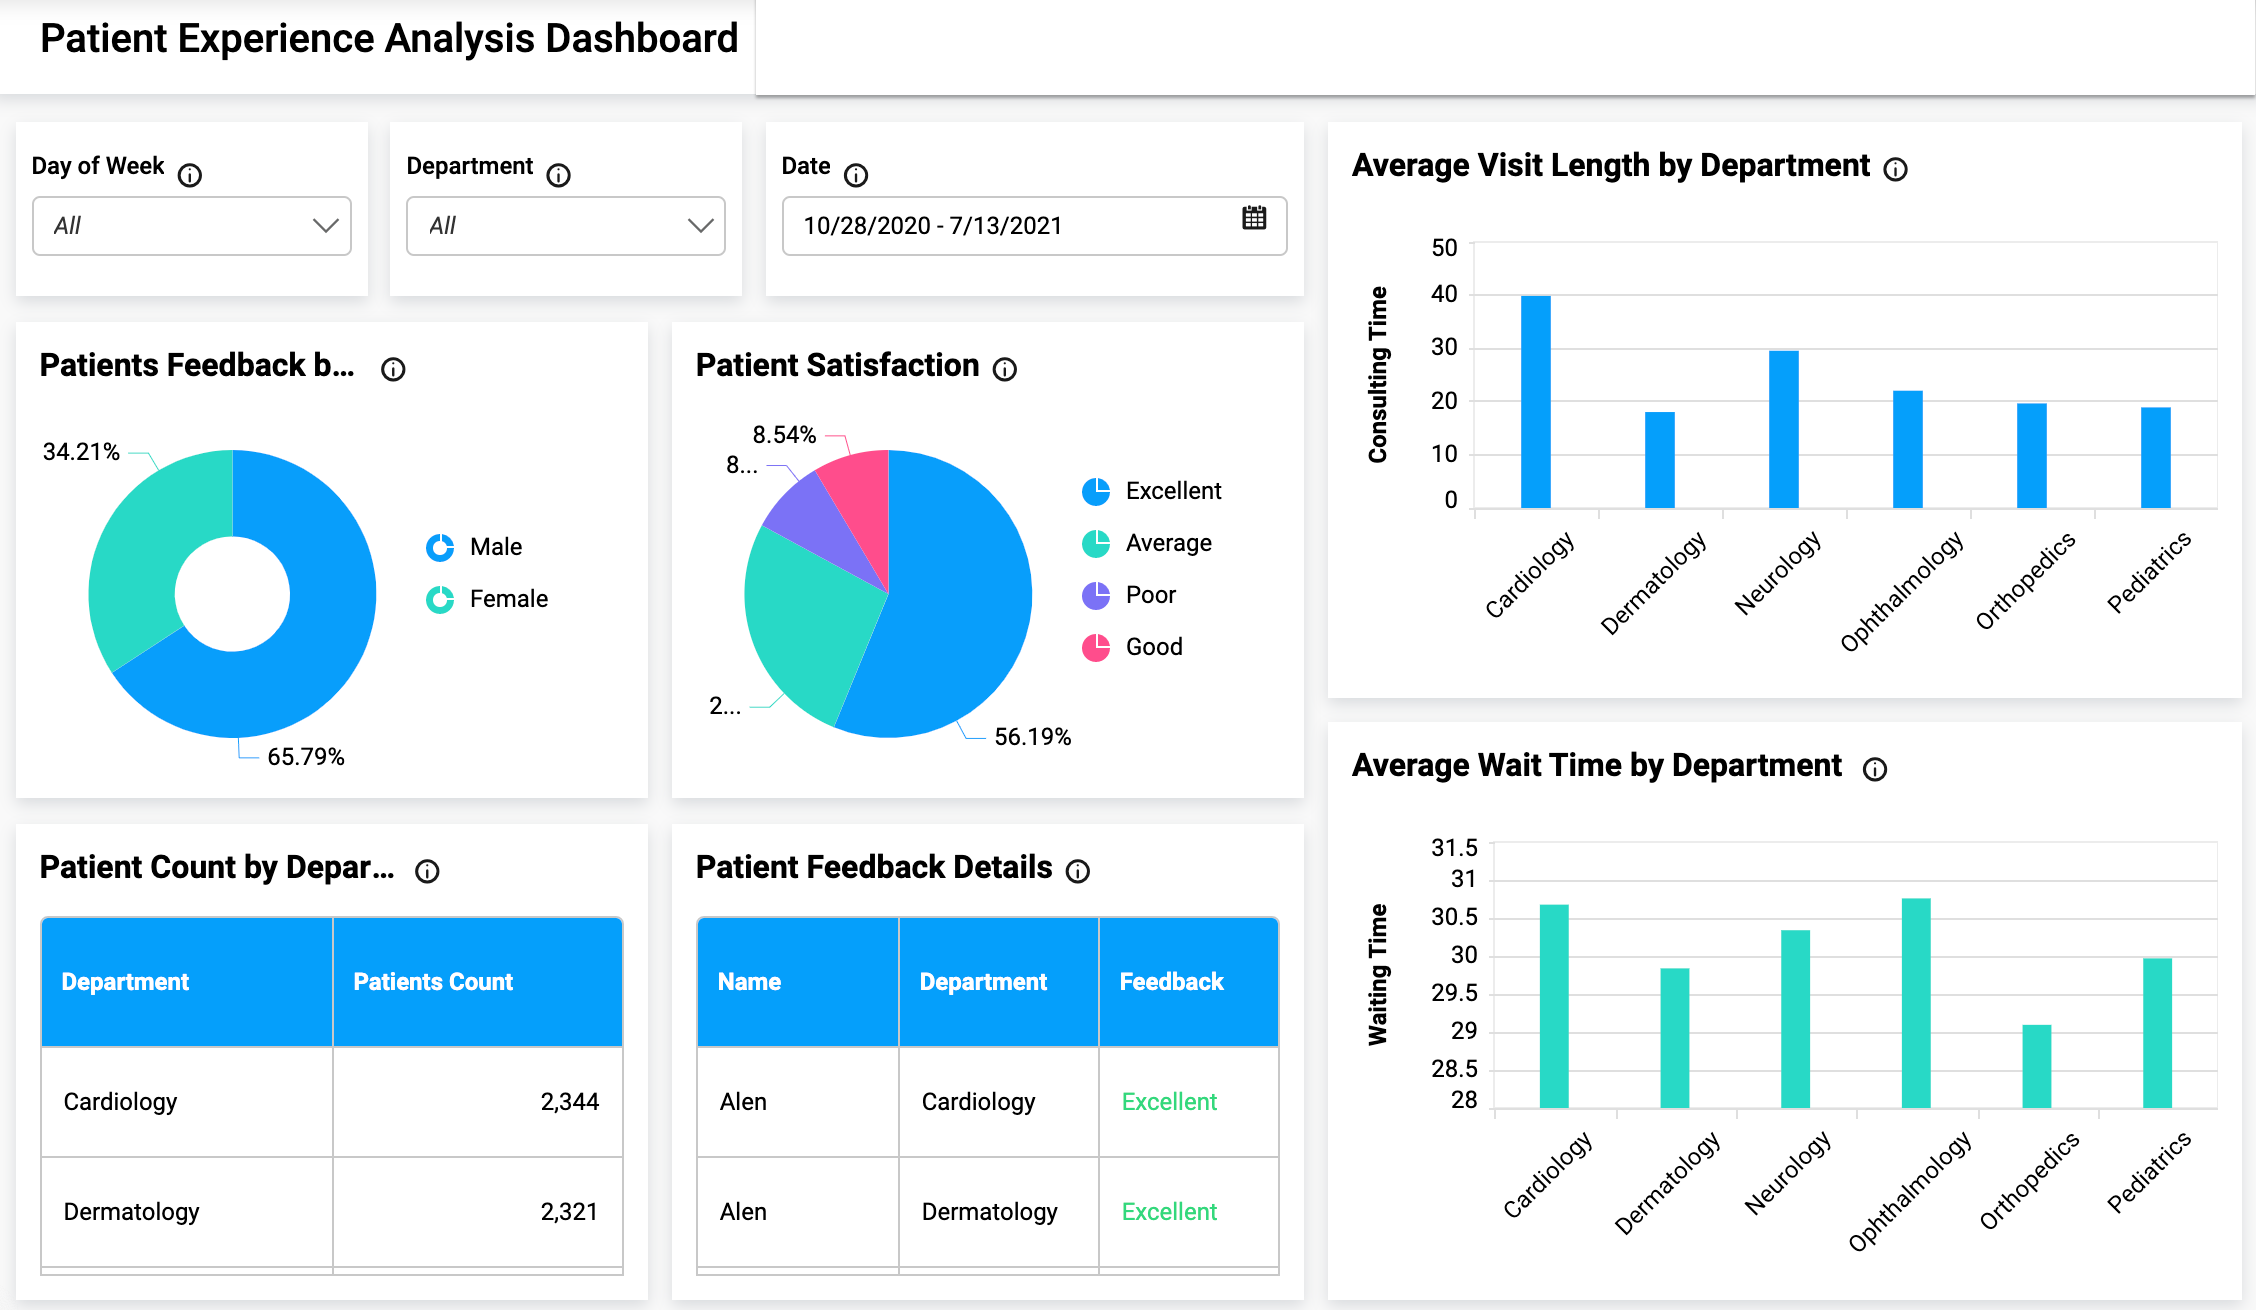
Interactive dashboards
Dashboards combine several interactive reports and are the most common visualization tool used by healthcare organizations. They can be built into existing software together with data analysis functionality or be a part of reporting software tailored to the organization's specific needs.
There are three main types of dashboards:
-
Operational for displaying real-time data
-
Strategic for showing patterns and trends over time
-
Analytical for more advanced analytics
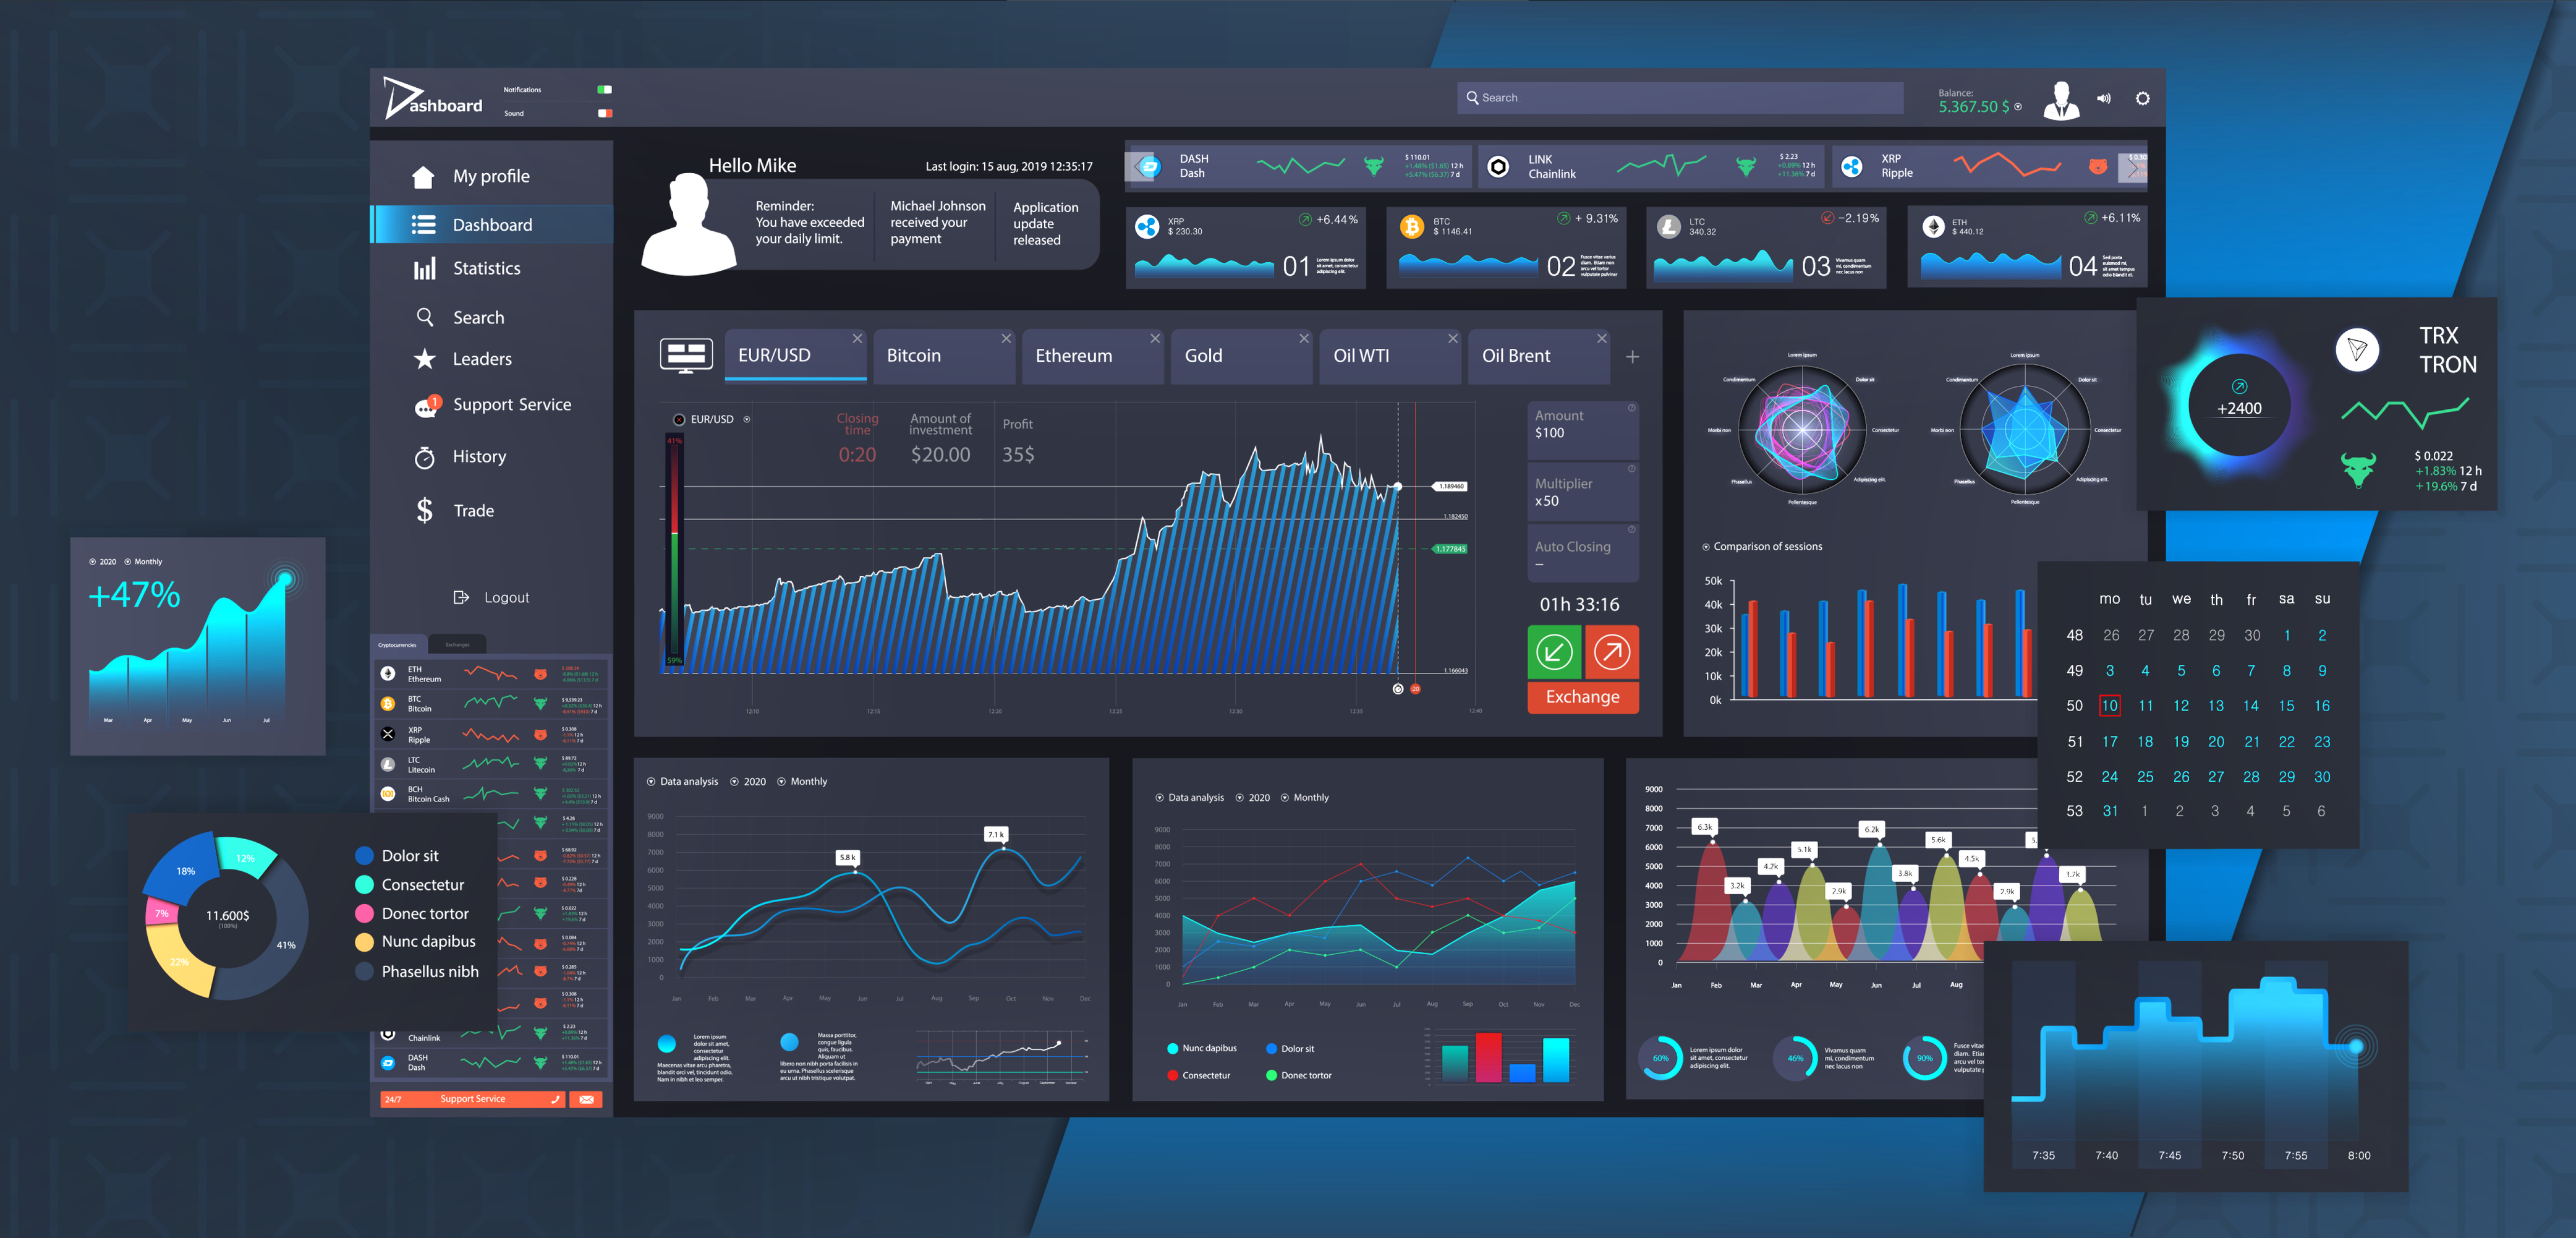
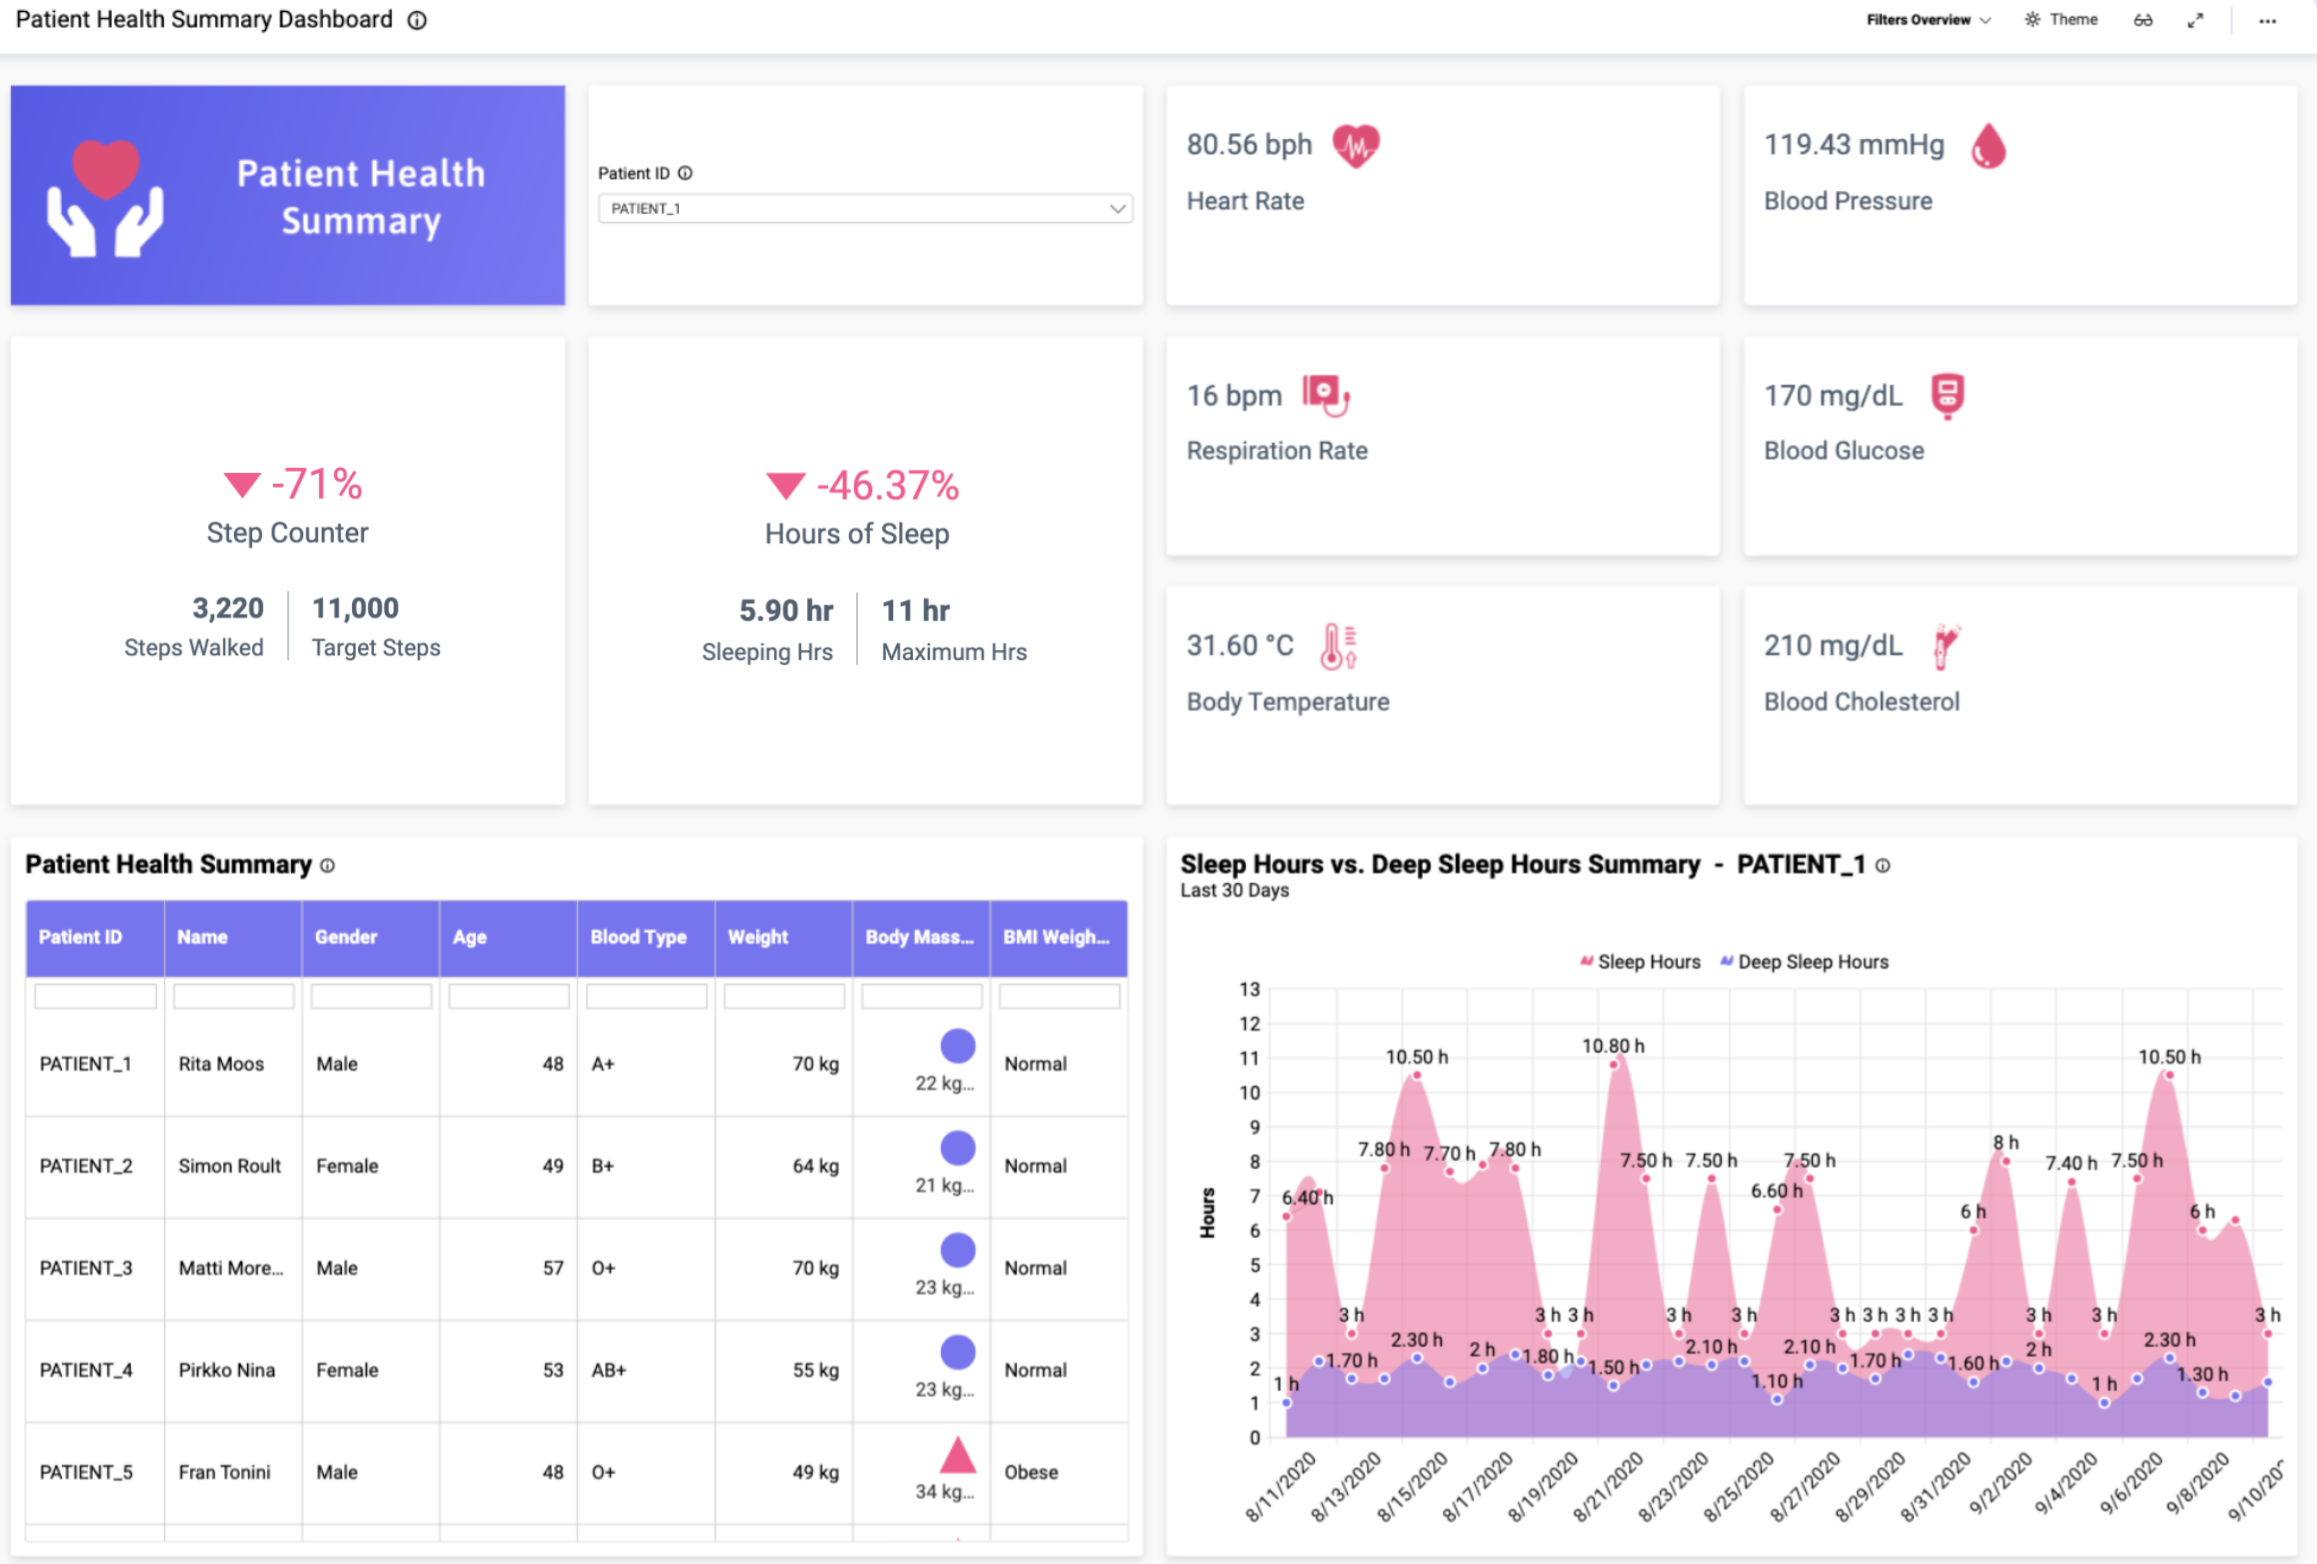
Below is an example of an analytical dashboard showing the results of patient experience analysis.
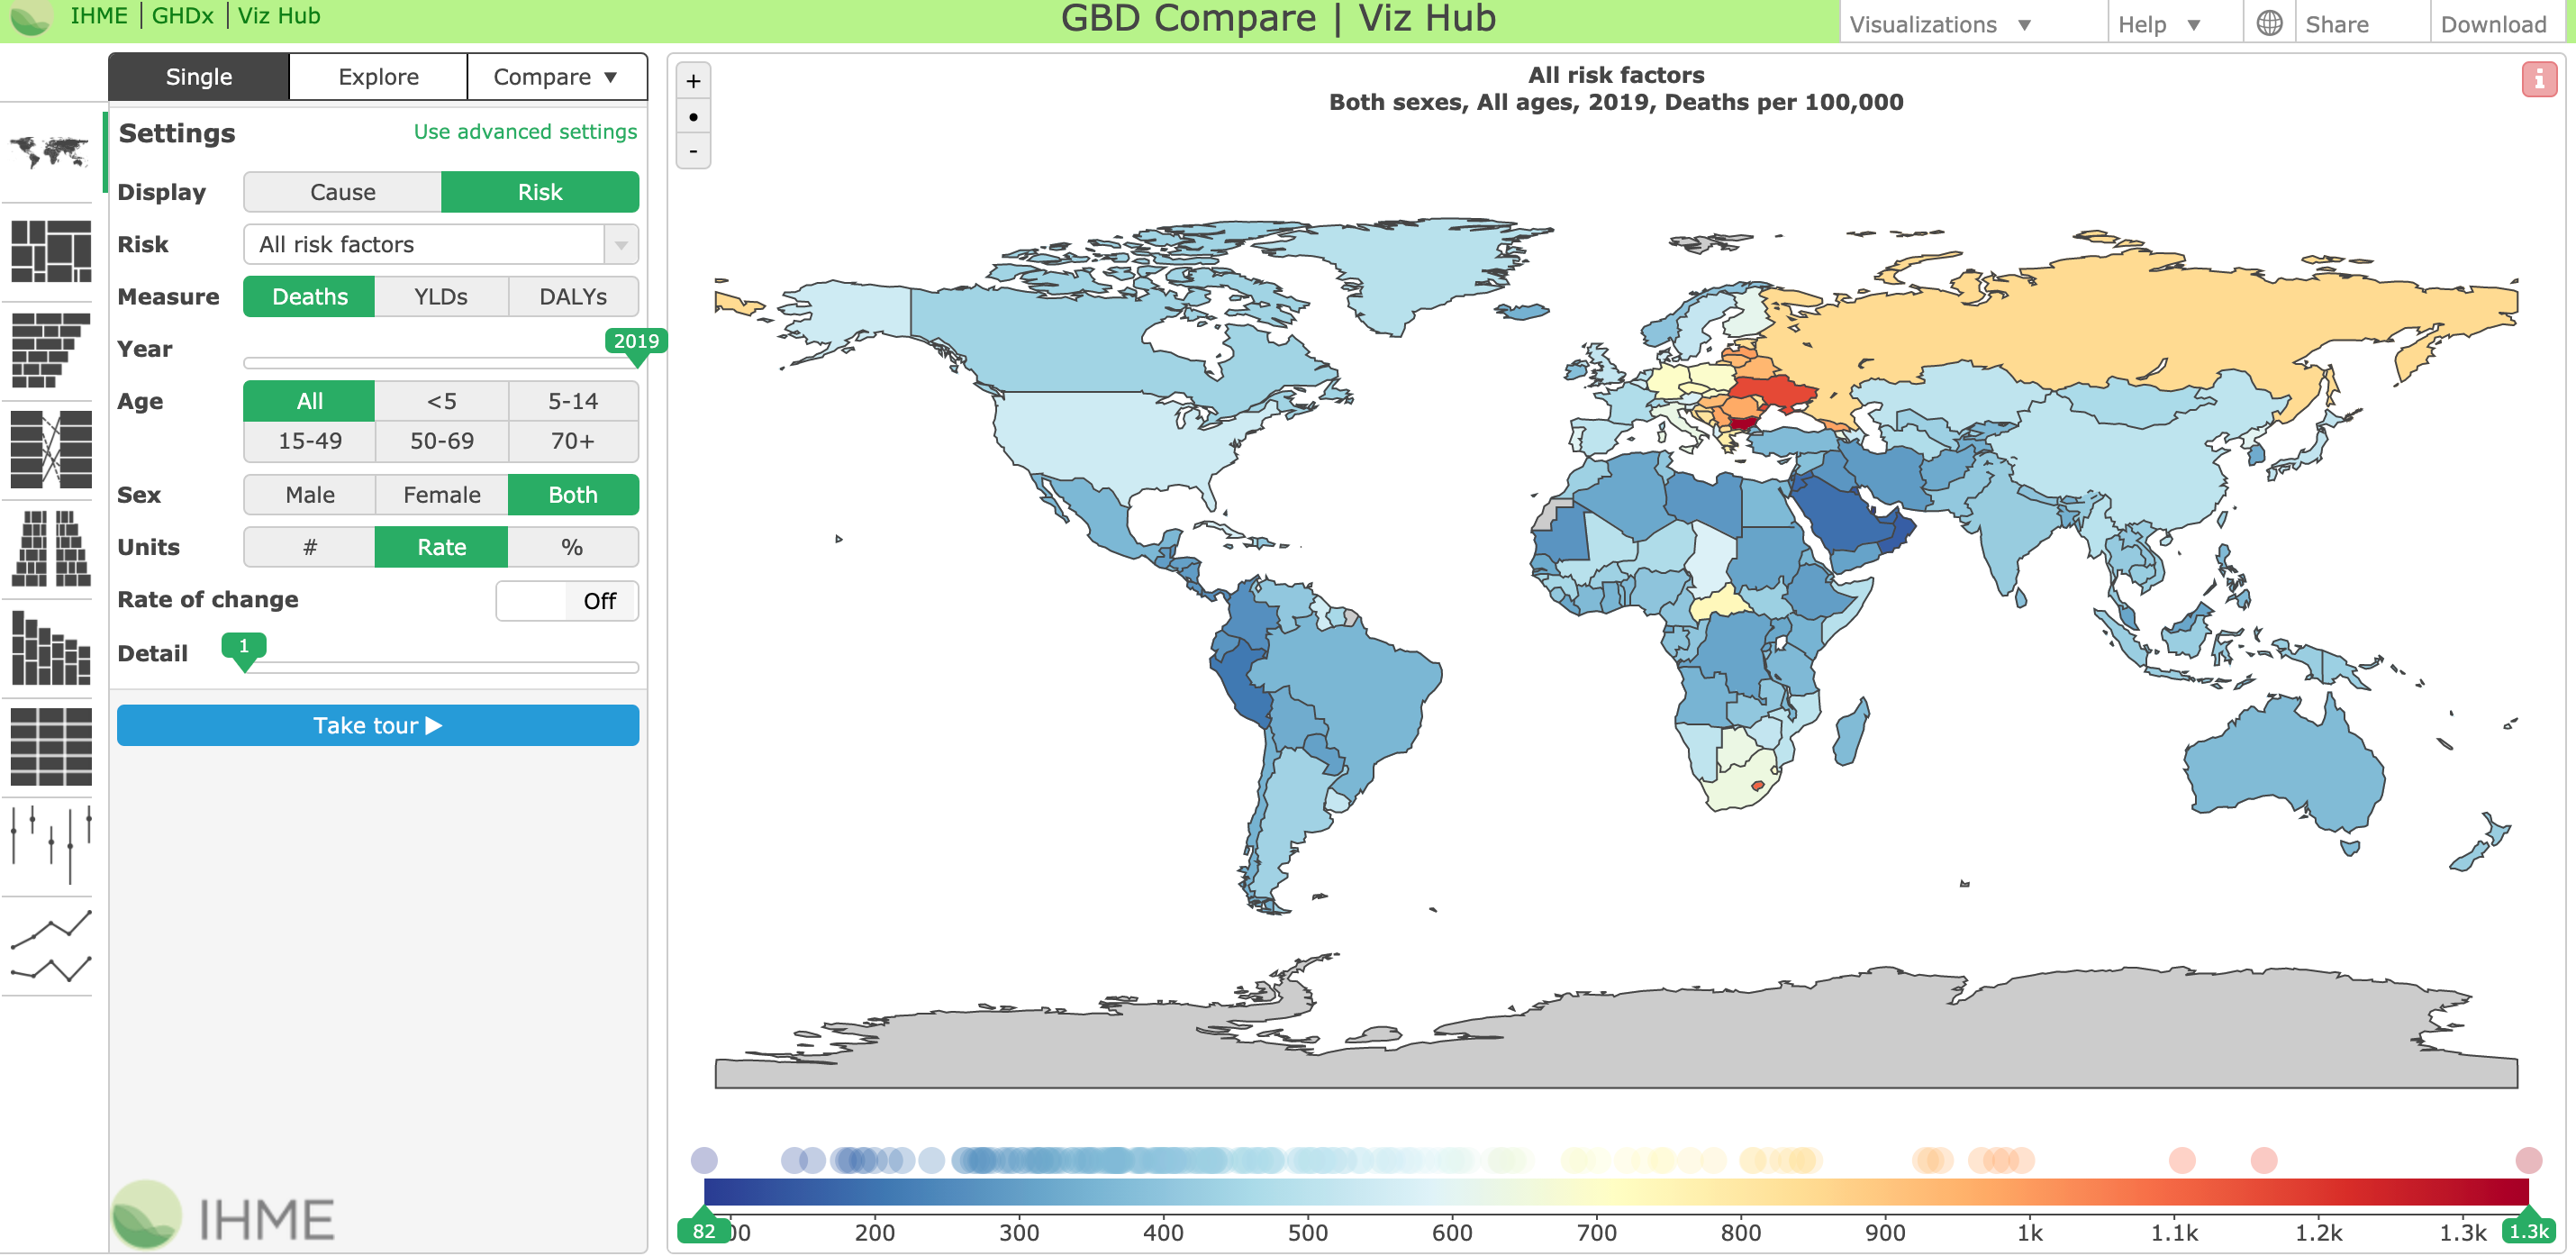
Interactive apps, sites, and widgets
Interactive maps, sites, or widgets allow users to choose how they interact with the data and focus on what's relevant. For example, the Institute for Health Metrics and Evaluation offers an interactive website to analyze death rates and leading death causes worldwide. There, you can switch between maps and charts or choose a specific country, age, or gender group.
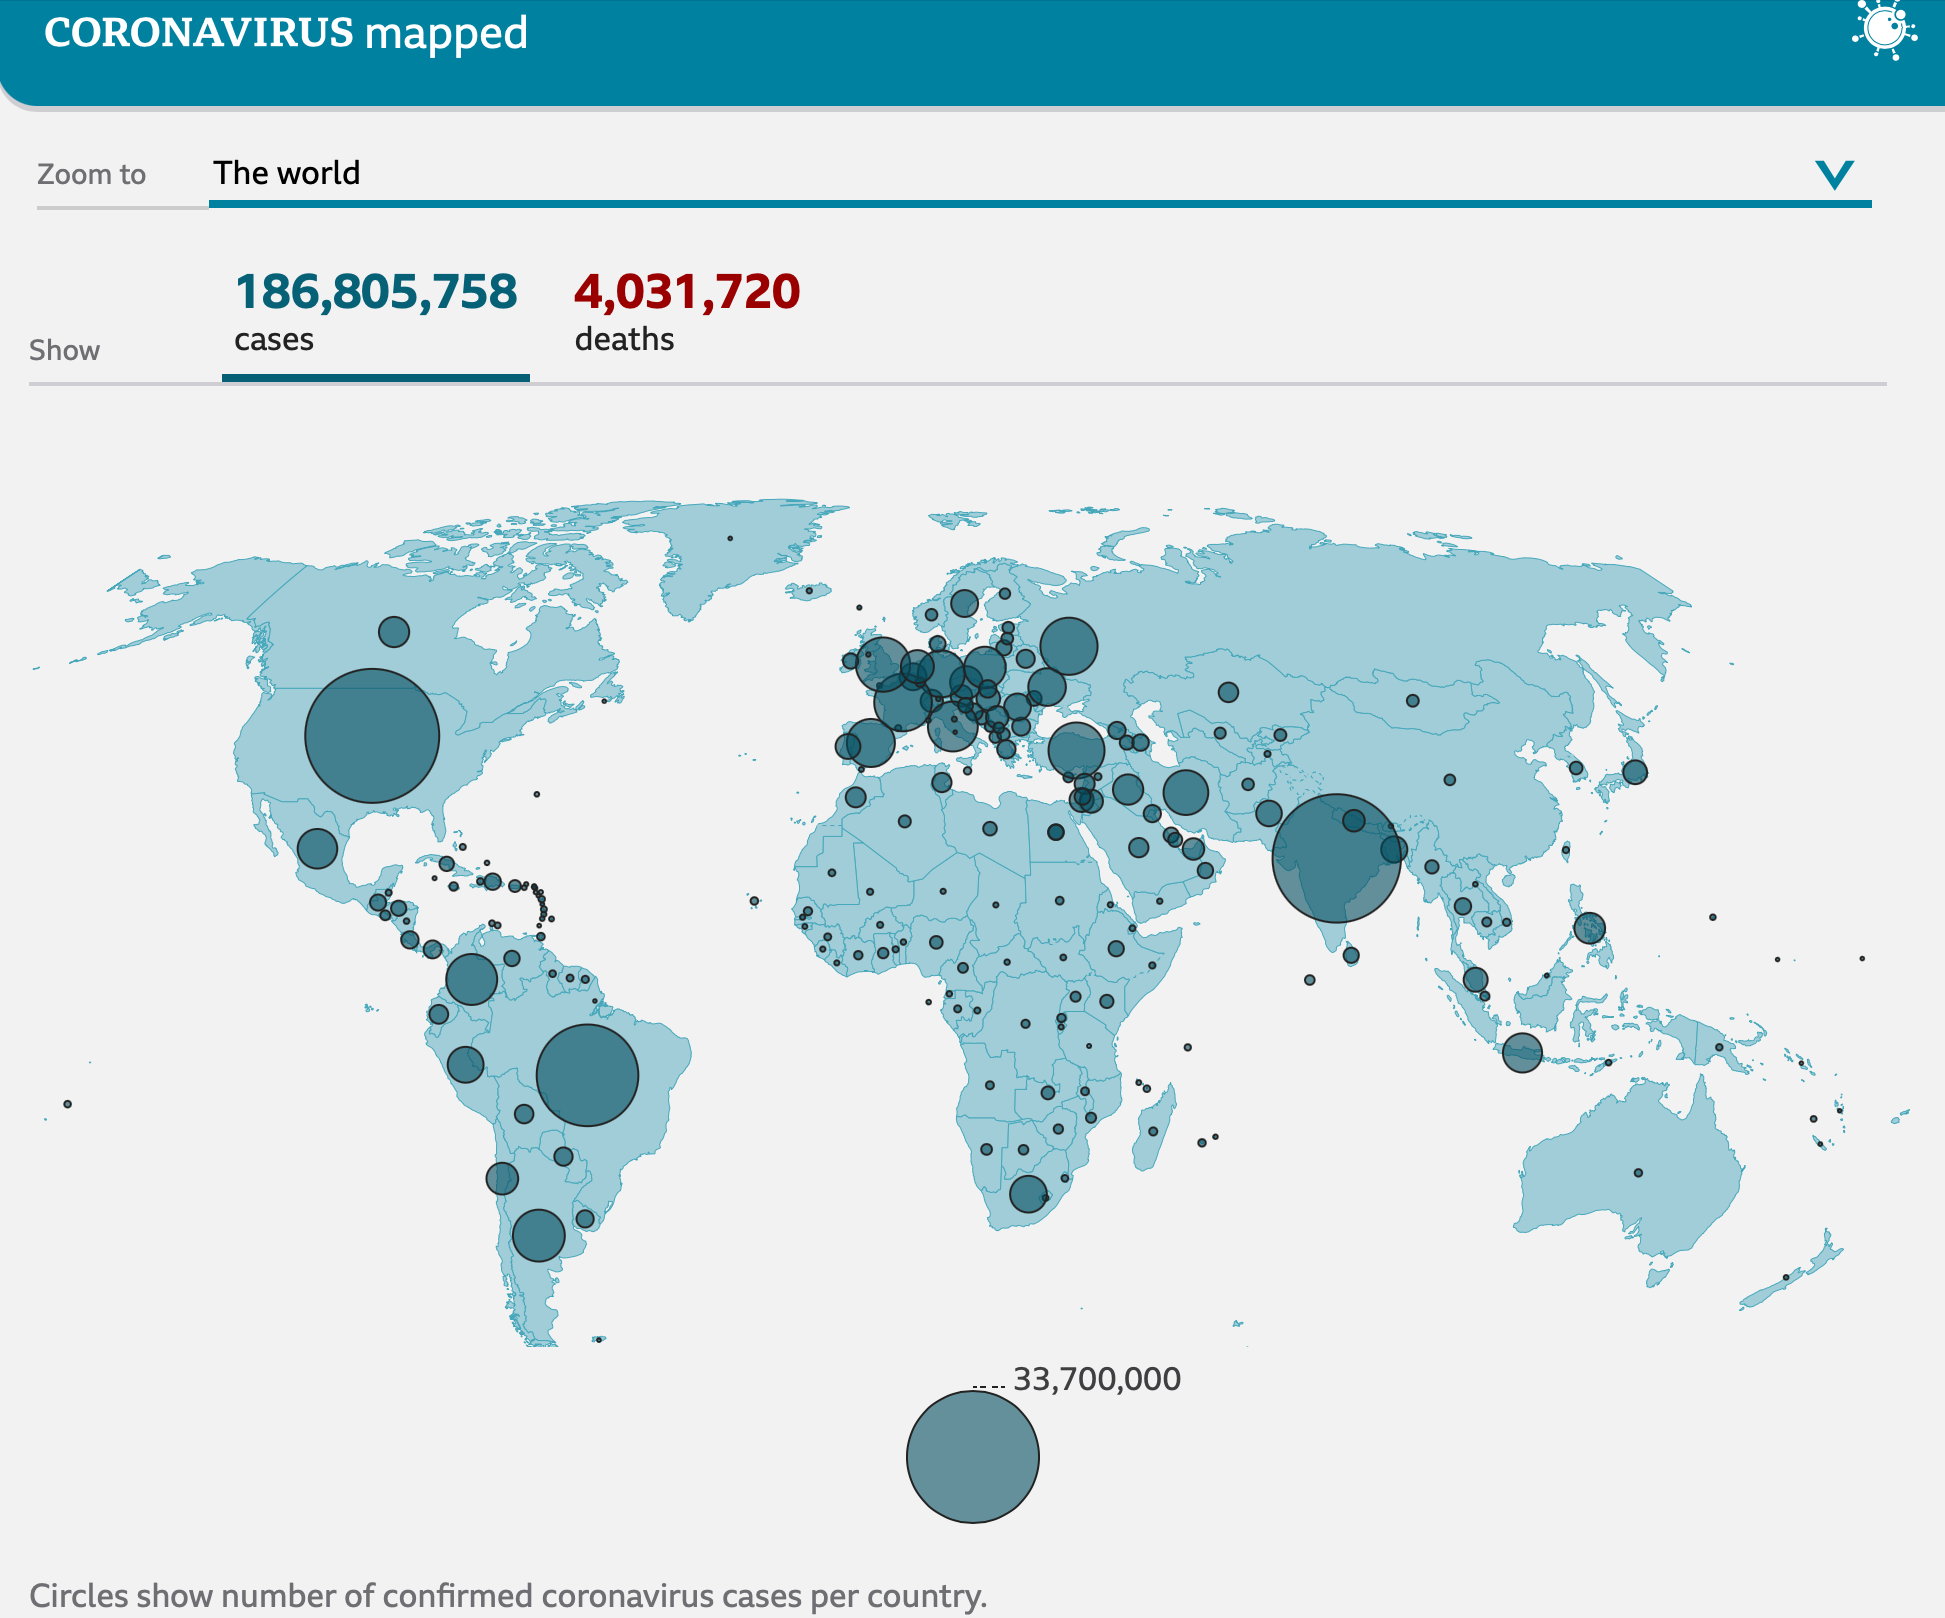
 Another example is the BBC website showing recent statistics on COVID-19 cases. The website is a mix of infographics, interactive maps, and charts that visualize statistical data.
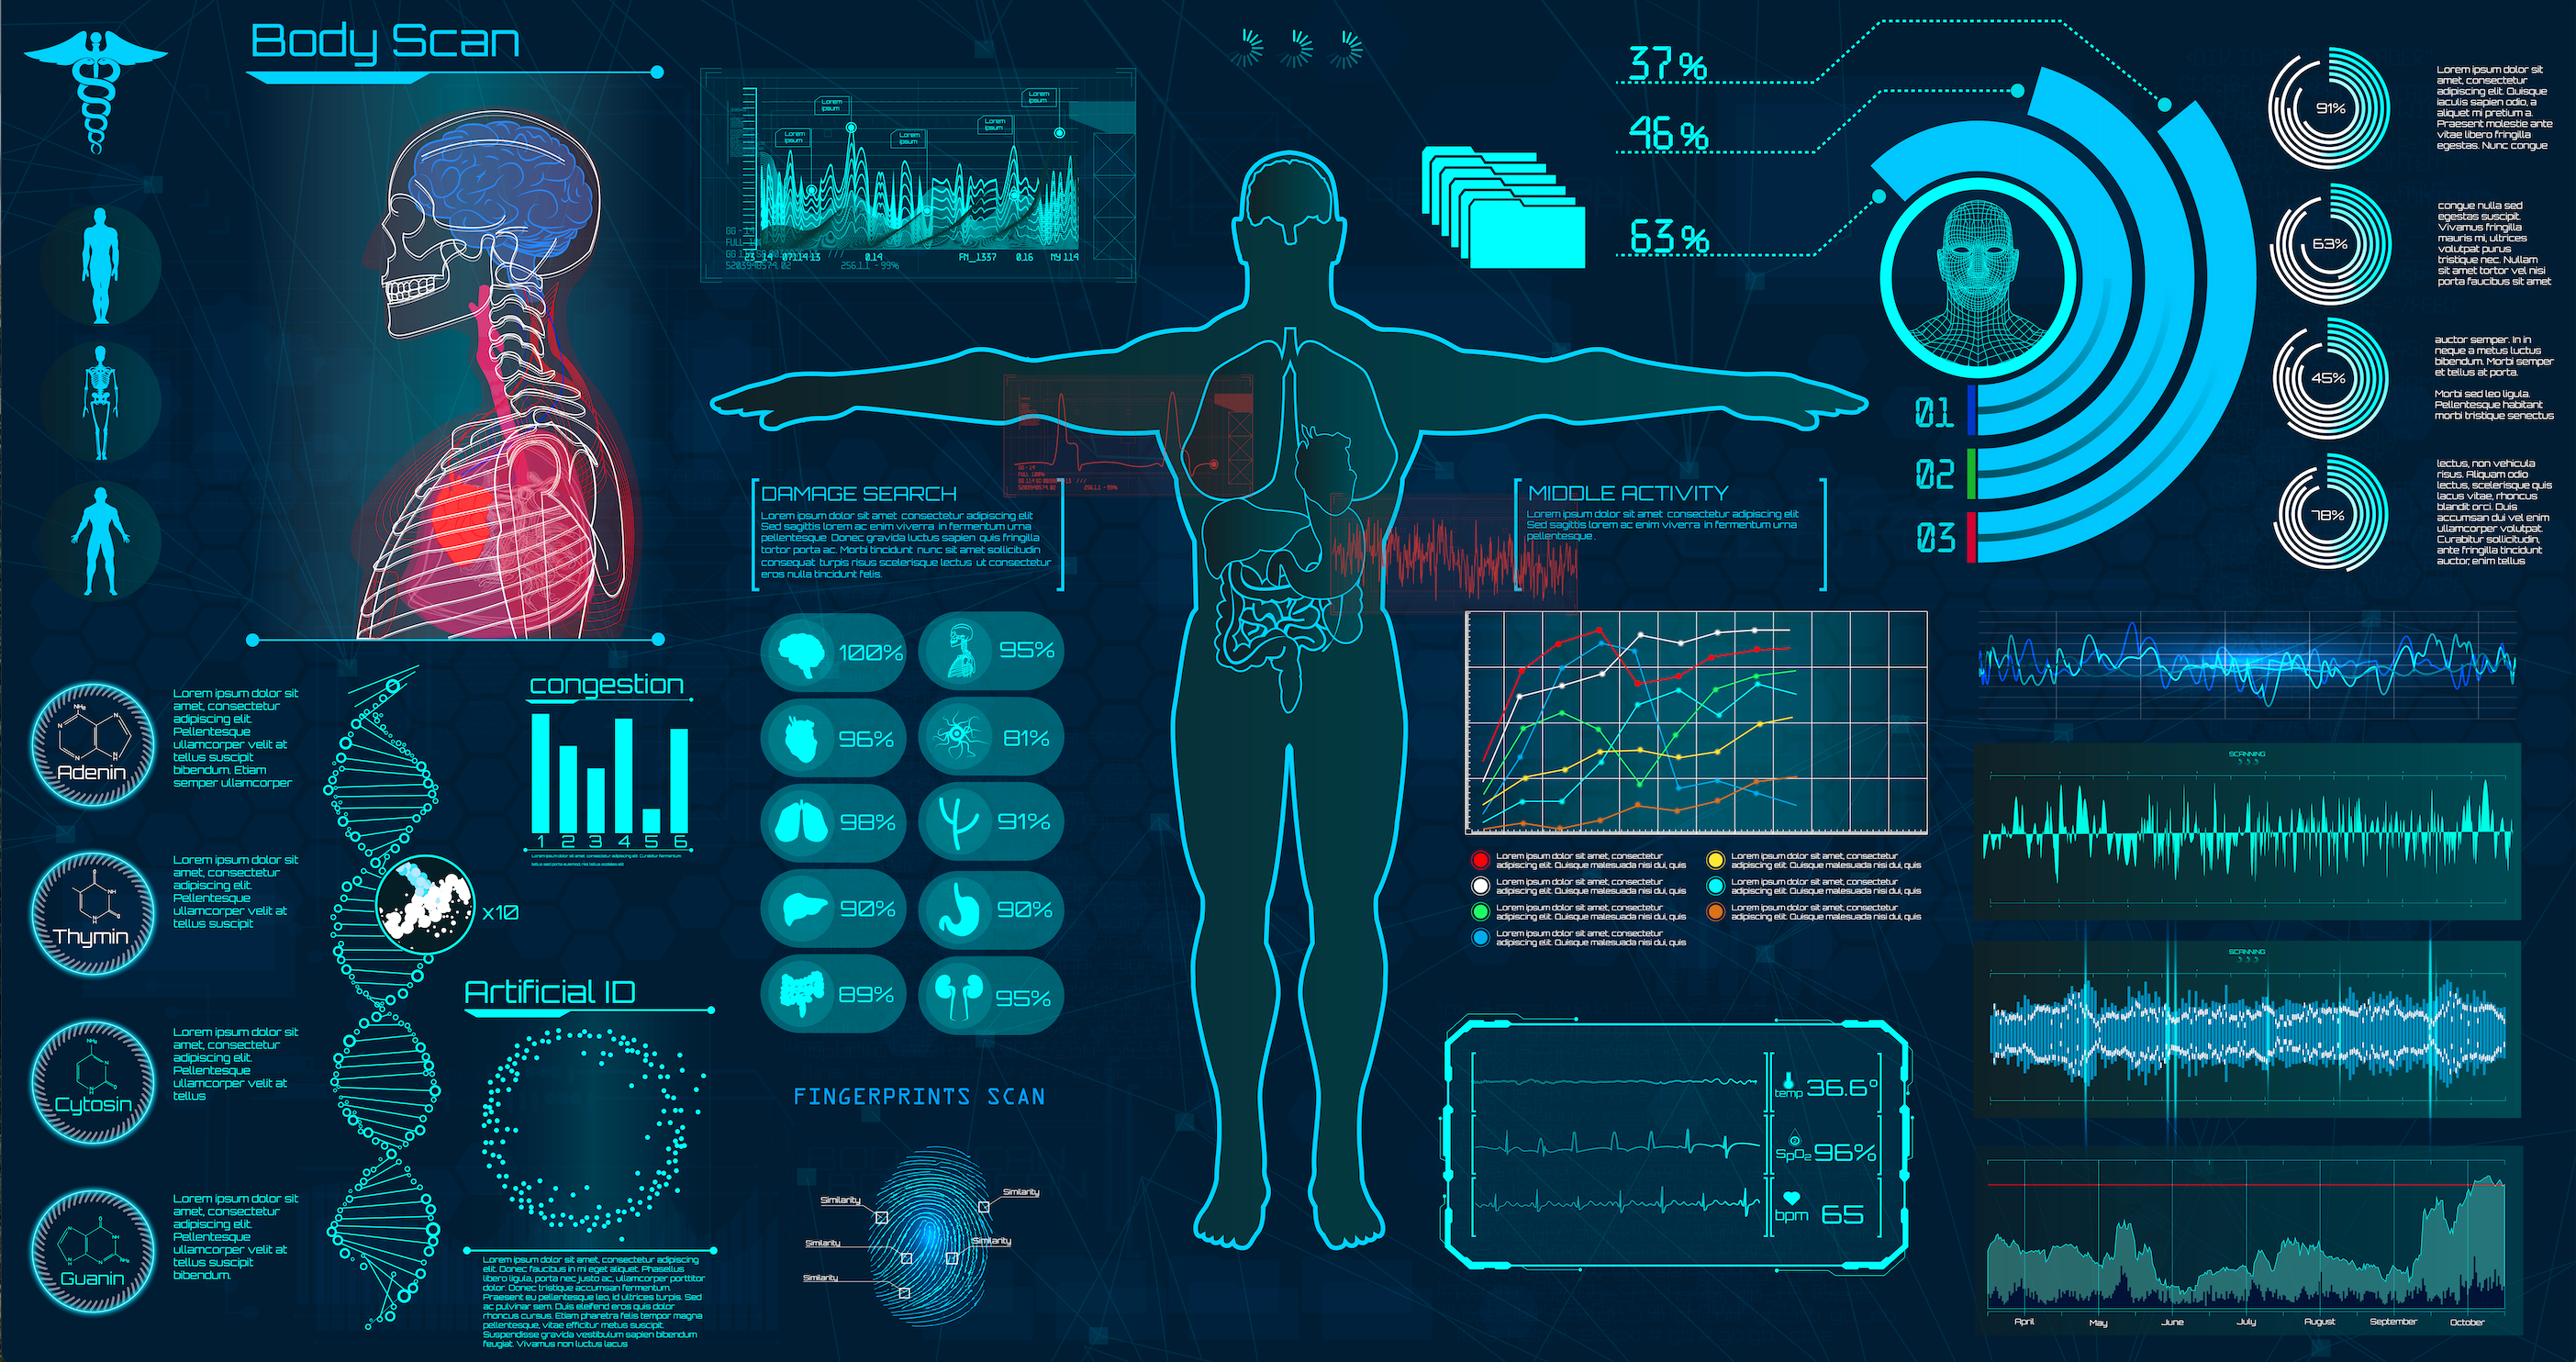
Infographics and motion graphics
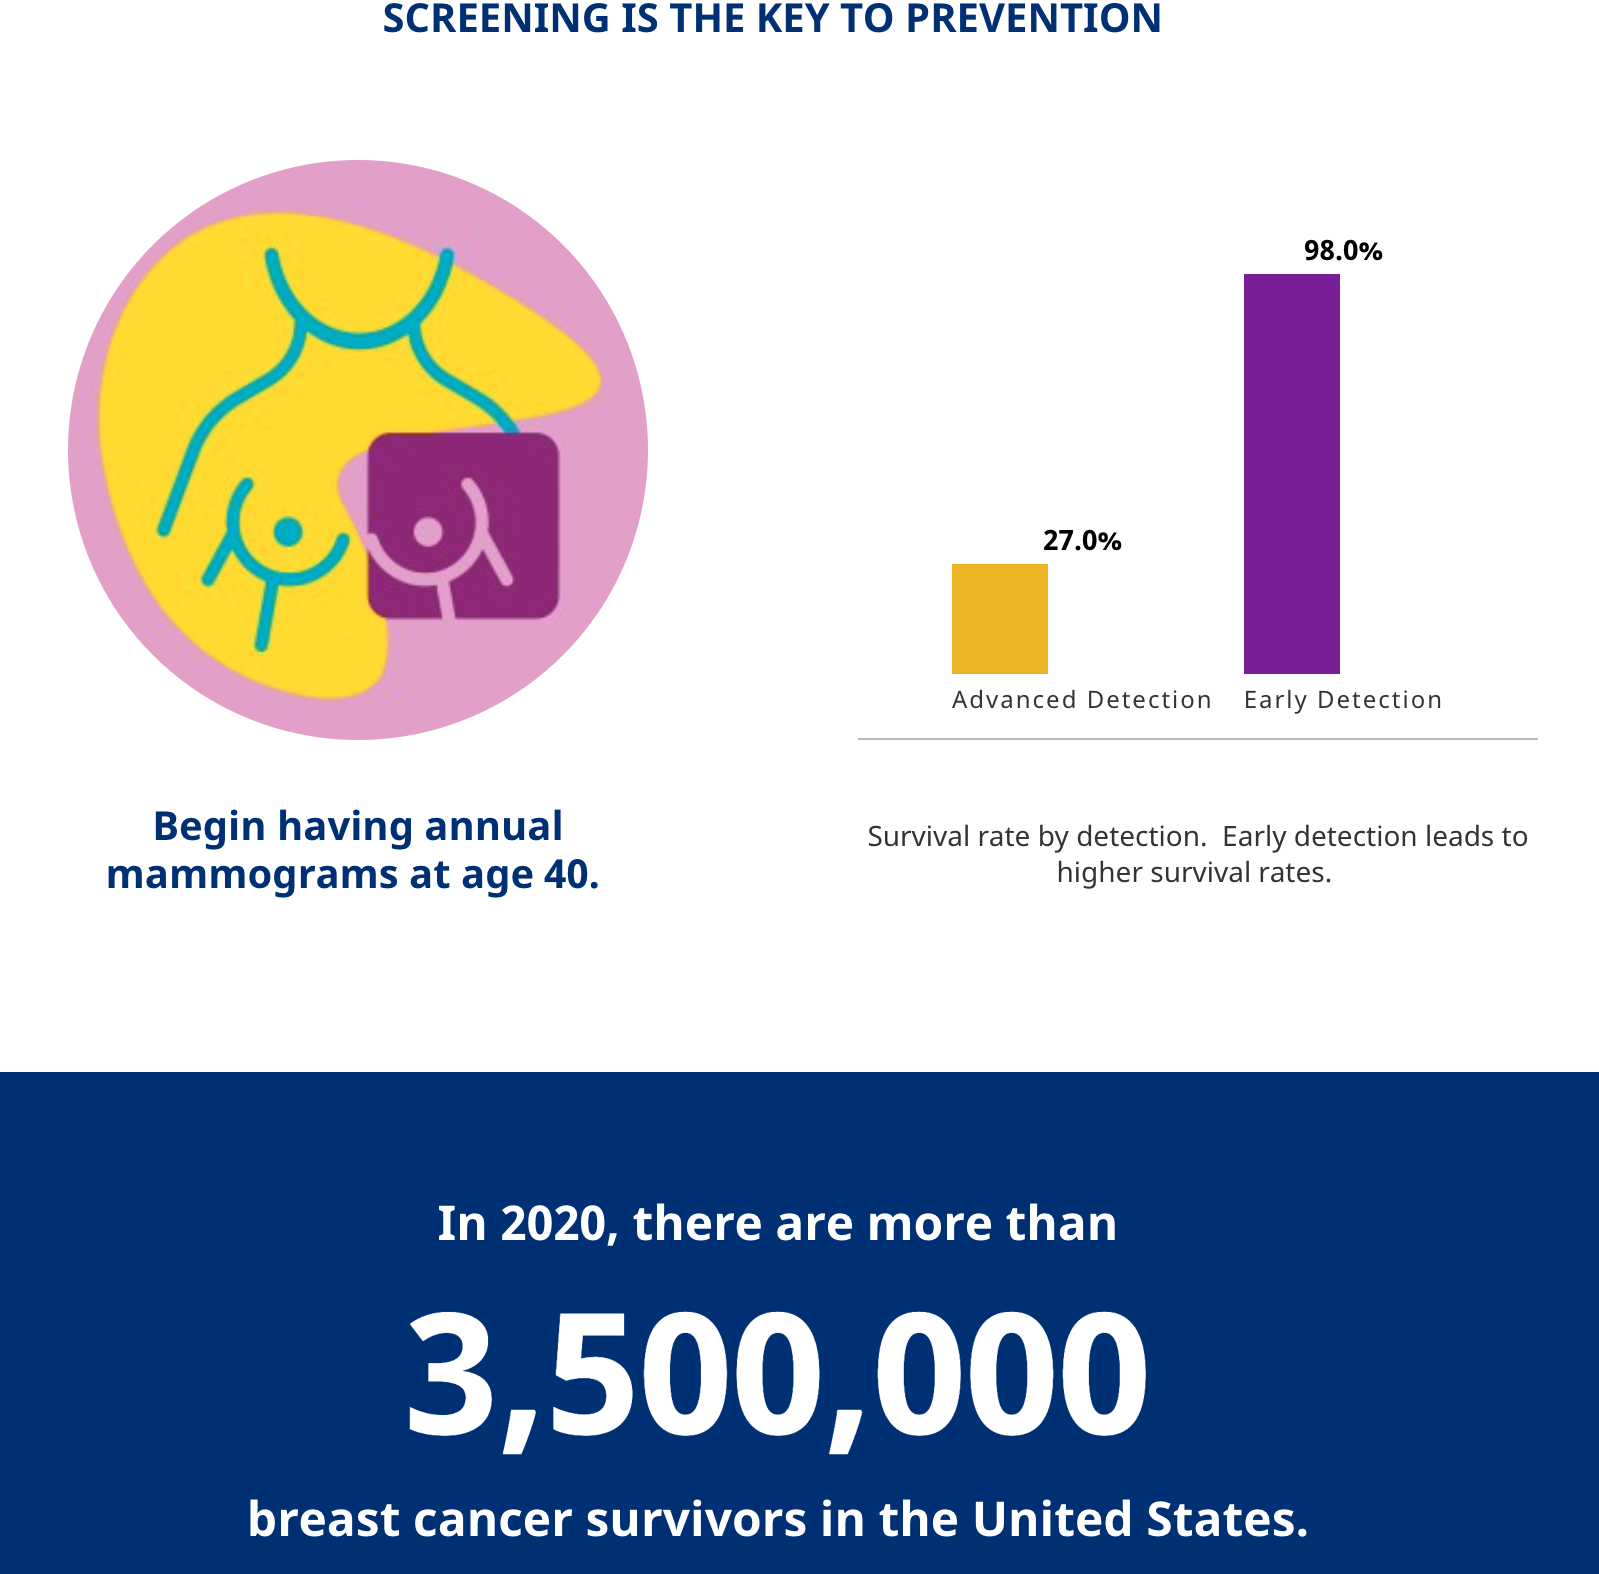
Infographic is a simple but powerful tool for visualizing complex data in a format the public can easily understand. For example, an infographic of Johns Hopkins University gives critical information about breast cancer, highlights the recent statistics, and provides science-backed recommendations on how to prevent the disease.
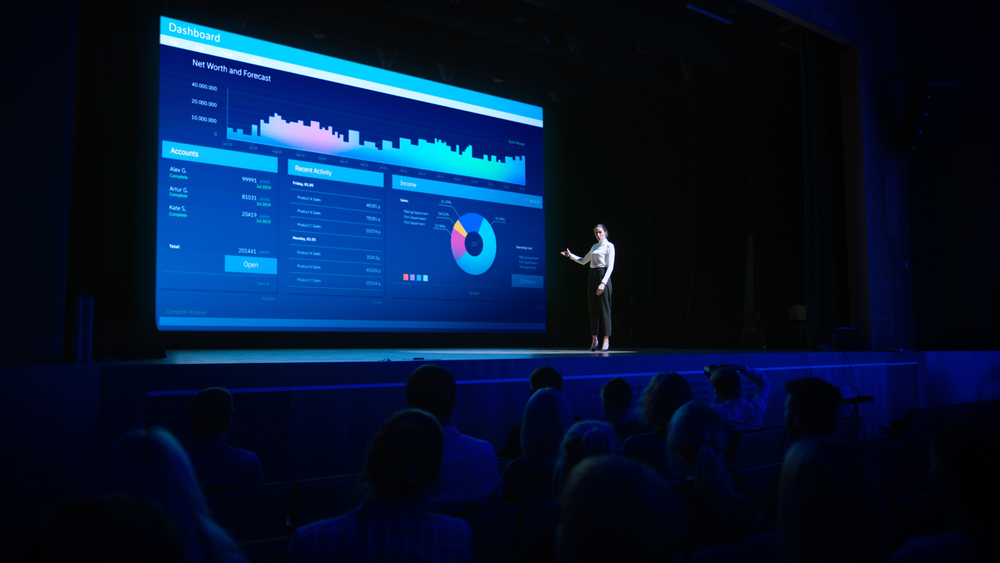
 Motion graphics is an example of an animated infographic often used in educational videos, promotional materials, or tutorials. As an example, here's a video explaining healthcare trends and technologies for predicting the future.
Healthcare data visualization tools allow everyone to view simplified information at a glance, resulting in better understanding and higher engagement, regardless of whether your audience is stakeholders or patients. This leads us to the next point.
How can data visualization improve healthcare?
Data analysis goes hand in hand with data preparation, data modeling, and data visualization. Today, healthcare analytics is becoming more advanced through the use of artificial intelligence (AI) and machine learning technologies. The adoption of visualization tools is a must-have for those organizations that want to benefit from data analysis to the full.
So what are the benefits of using data visualization in healthcare? Here's the rundown on five of them.
Improved patient care
Visualization brings what matters into focus, helping medical staff identify and react faster to threats. By visualizing real-time data on patient health status, doctors can define and group patients according to the treatment and attention they need. Including all patient records in a dashboard also prevents practitioners from missing important information. Case in point, this may lead to a fewer number of drug intolerance incidents, improving the efficiency of treatment.
Trends and pattern recognition
By using data visualization software that is often paired with built-in predictive analytics tools, doctors can estimate changes in patient health status and make better diagnoses. Collecting heart rate data from fitness apps and wearable devices, for example, can reveal possible risks before the problem occurs.
Along with pattern recognition in patient care, visualization of healthcare data also helps the government identify trends in statistical and research reports, improving their strategic decisions related to public health. For example, 90% of locations in the US had enforced mandates such as mask-wearing and social distancing when the number of deaths daily reached eight per million.
Data presentations for different audiences
Visuals can help a lot when you need to present data to business owners and other stakeholders or use it in healthcare marketing campaigns. Our brain understands visual content better than endless lines of text. With healthcare data visualization solutions, everyone can generate meaningful insight and make data-driven decisions regardless of data literacy or business analytics skills.
It’s also good to use visualization for patient education since clear and easy-to-understand charts and infographics will help improve patient awareness and increase engagement. This, in turn, can lead to better lifestyle choices and promote a focus on what needs improvement, such as activity, body weight, or eating habits.
Accelerated performance
Unlike lengthy, manual reporting, real-time data visualization significantly speeds up the analysis of information, helping healthcare organizations minimize process inefficiencies, accelerate the decision-making process, and optimize costs.
Hospitals, for example, receive financial incentives or penalties from Medicare based on patient satisfaction scores. By tracking and visualizing parameters related to the patient experience, such as their feedback on communication with medical staff or wait time, hospitals can identify problems to focus on and improve their results.
Errors and fraud detection
The annual cost of fraud and abuse in Medicare alone ranges from $58.5 to $83.9 billion. Fraud schemes are committed by medical providers and patients and can include double or phantom billing, multiple bills for a single service, forged prescriptions, insurance cheating, and more.
Data visualization improves the transparency of connections between patients, practitioners, providers, payers, and claims. Paired with machine learning and AI technologies, visualization enables users to avoid errors and mess, as well as to quickly detect anomalies and potential fraud incidents related to medical billing or prescriptions.
Of course, this is not an exhaustive list of all benefits. Still, it gives a better understanding of how the visualization of data helps healthcare and why more and more medical organizations adopt visualization tools into their practice. And if you are about to implement it yourself, here are several visualization tools to consider.
Which data visualization tools are used in healthcare
When it comes to data visualization, organizations have two options—custom software development or ready-made apps. Custom software is the better choice since you can tailor them to meet the specific needs of your organization. By contrast, customization of ready-made solutions is limited and may not integrate all of your data sources.
If you aren’t yet ready to invest in custom software development and want to check out how visualization tools work, here are three options for you.
Tableau
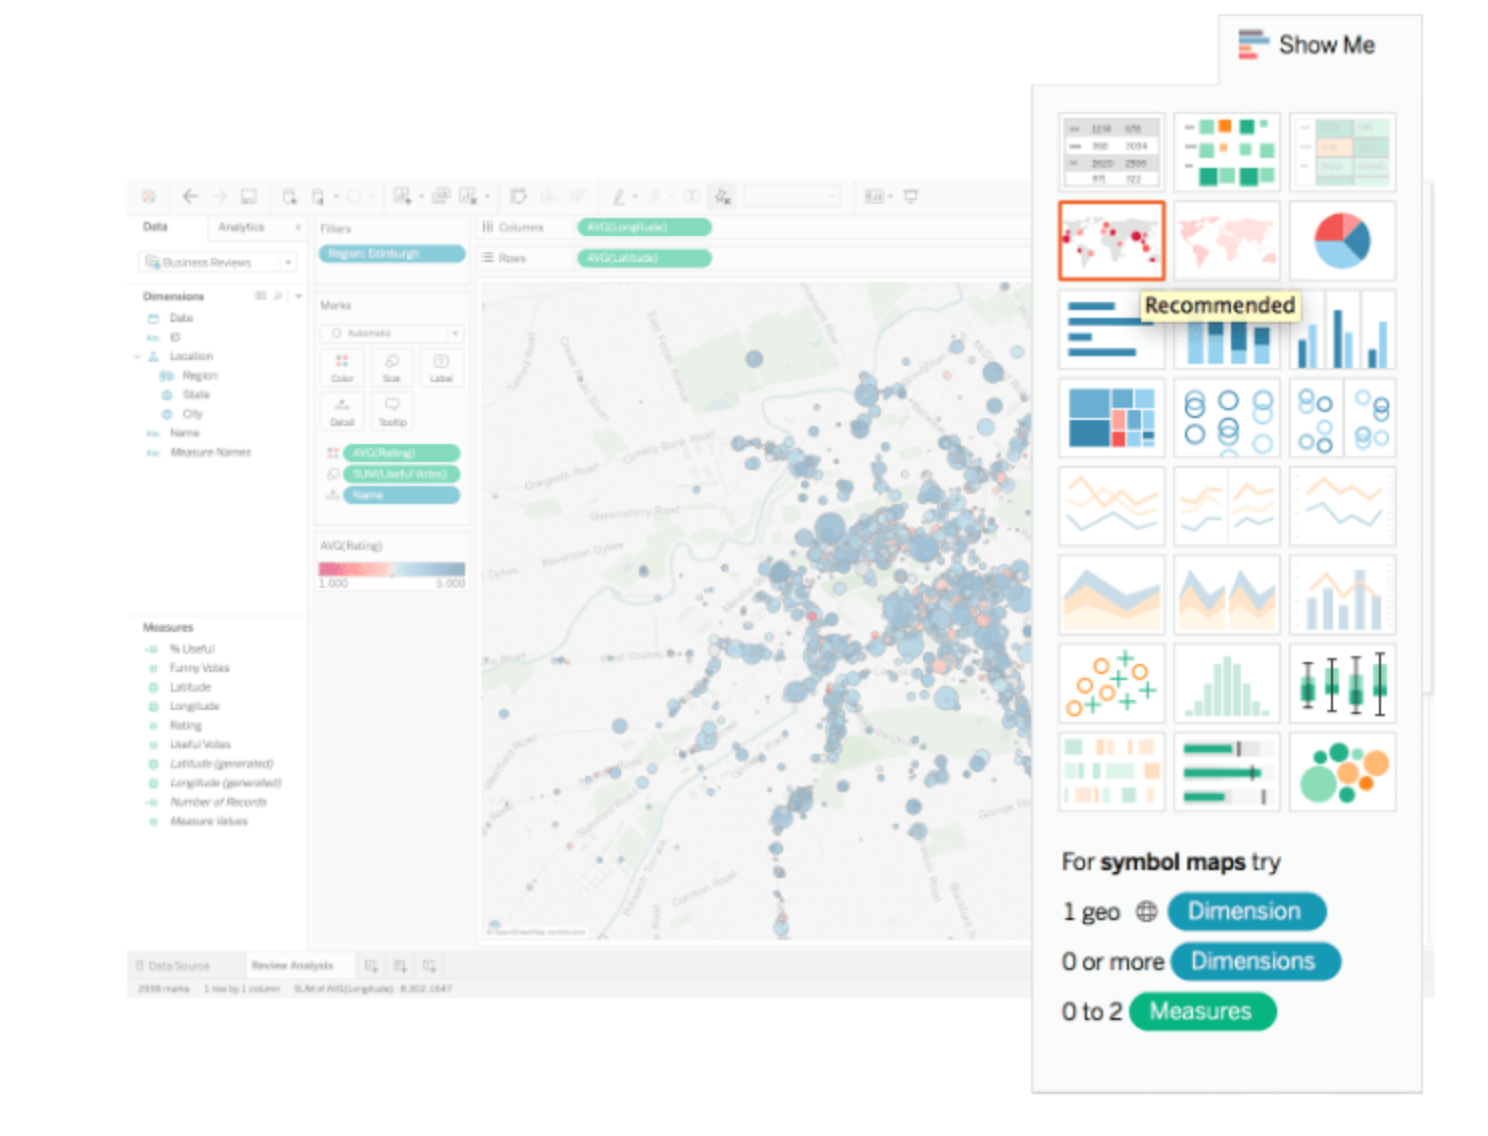 Tableau is one of the leading platforms for modern business intelligence. Giants such as UNC Health, Providence St. Joseph Health, Cigna, Pfizer, and Michigan Medicine, among others, use this platform for data analytics and visualization thanks to its rich functionality and machine learning tools. What's more, Tableau has a global data community of more than a million members, active forums, and training programs to support its clients and users across the world.
Domo
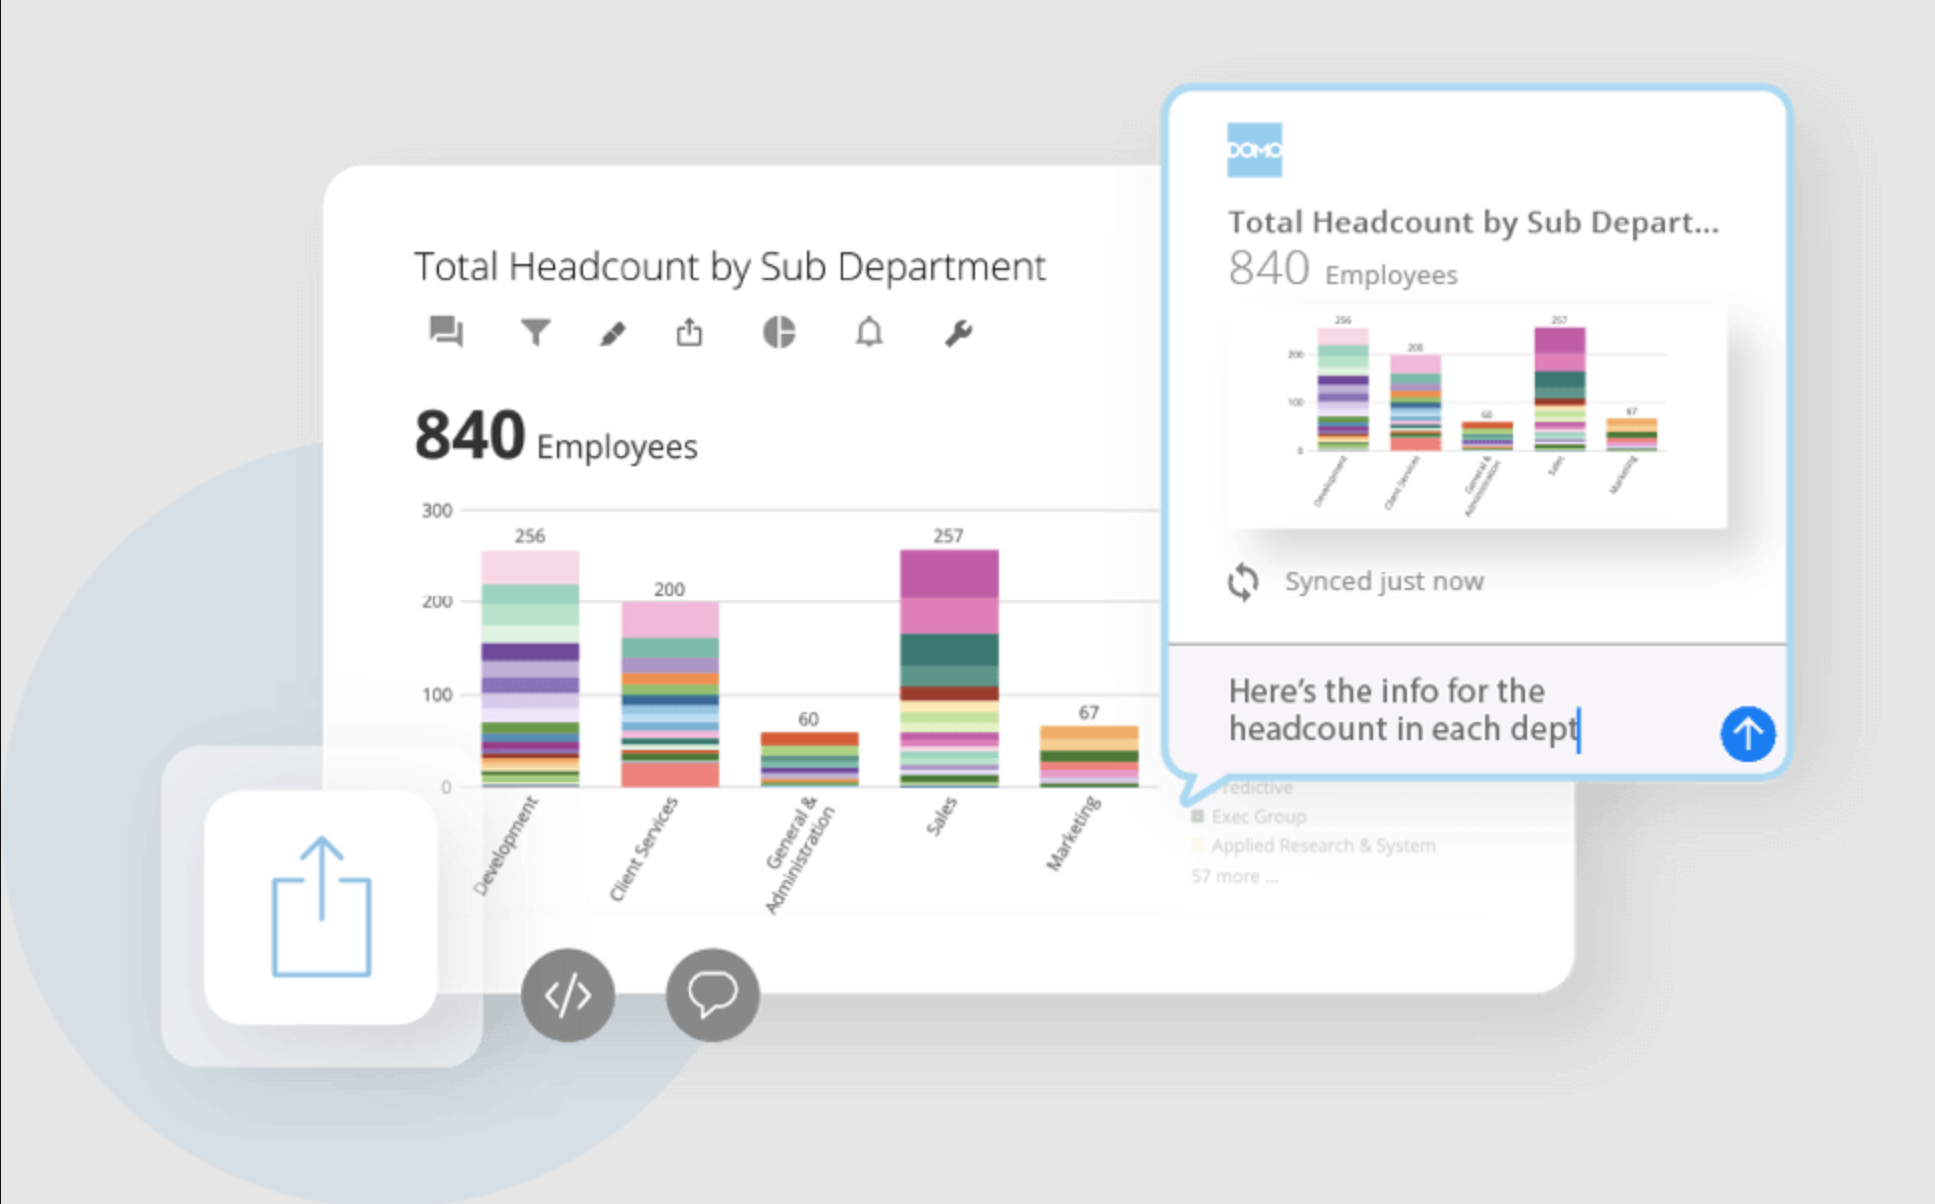
Domo is an integrated platform for data integration, business intelligence, and embedded analytics. The platform allows healthcare organizations to combine real-time data into intuitive and customizable dashboards. In addition, Domo offers app-building frameworks to create applications for automation and data intelligence.
Bold BI
Bold BI creates fully customizable dashboards that allow you to track various performance indicators. The platform is designed to be embedded regardless of what your data sources are. With a powerful SDK that targets all major frameworks on both the server and client-side, the platform can integrate seamlessly with your applications on public or private clouds, as well as with your own hardware.
Visualize your healthcare data with Demigos
Healthcare data visualization is one of the crucial stages of data analysis. It enables faster interpretation and a deeper understanding of information, resulting in better decisions and quick actions when they’re needed. The importance of data visualization in healthcare is hard to underrate. Healthcare organizations use it for improving care delivery and coordination, educating patients, and enhancing performance.
If you want to enjoy feature-rich visualization software tailored to your needs, joining forces with a reliable health tech company like Demigos can give you a jump start. Demigos specializes in software development for the healthcare industry and can help you build a data visualization solution or integrate a ready-made one into your system.
We are HIPAA and GDPR compliant and have the knowledge and experience to build a healthcare software product your organization will love. Contact us today to discuss your project.