Let's have a conversation
We will get back in touch with you
Website and analytics
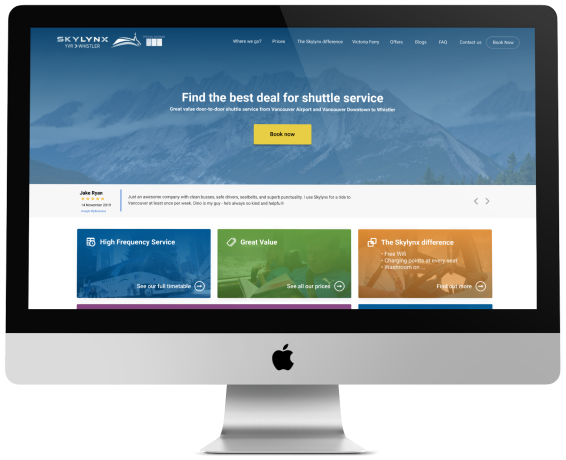
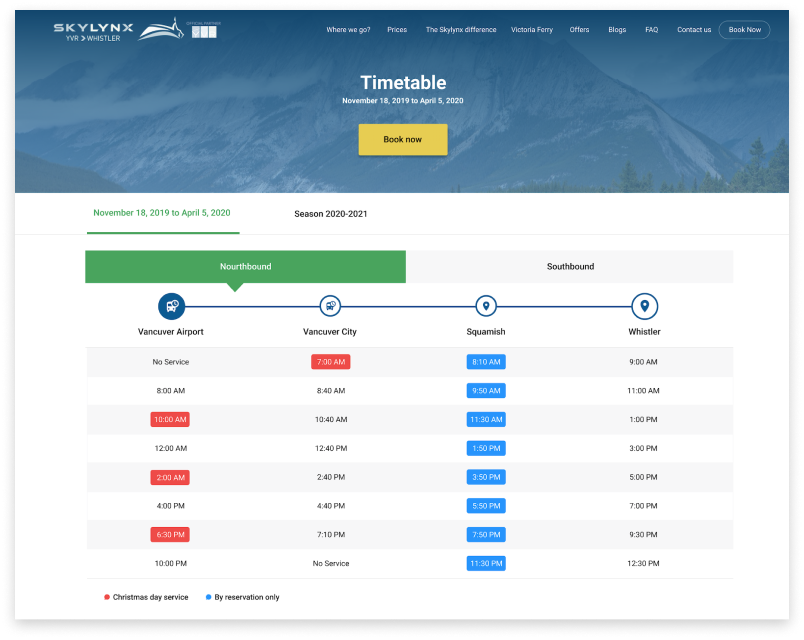
YVRSkylynx offers one of the most frequent Whistler bus schedules from YVR Vancouver Airport and Vancouver in Canada. YVRSKylynx transports thousands of customers to a popular tourist area. The company is an official partner of YVR Vancouver Airport.
The company needed a brand new website, and we launched the new version literally in 3 weeks. We did many other improvements to the website later.
Another objective for us was to help with tracking of their spending on ads, and we provided end-to-end analytics to track ROMI for every advertisement channel.
We also gathered analytics on user behavior and it led to changes in design which improved sales.
The first version of the website was developed in a very short term - we delivered it in 3 weeks. The company just started so they needed a website to start sales as soon as possible. We began development in November and needed to deliver it by Christmas holidays - the hottest season for Whistler skiing resort where the company organizes bus tours.
After launch, the website had around 1000 daily users and sales steadily grew.
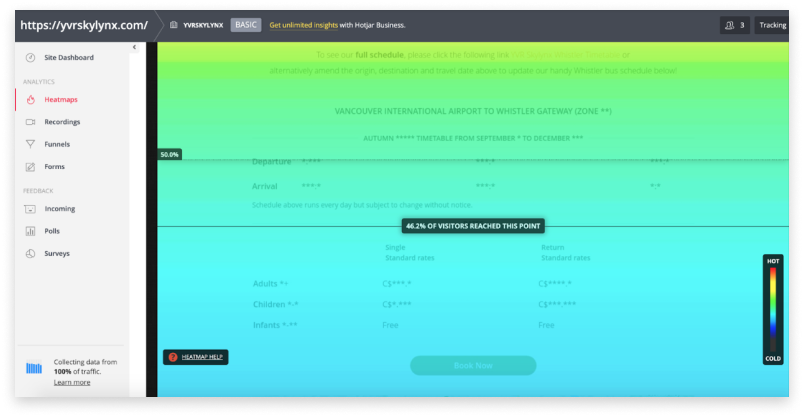
But we could see there’s room for improvement. Based on the data from analytics and feedback from the client’s team, we figured out that the current website is not optimal in terms of conversions. Many of the essential website sections and therefore the company’s propositions were not visible to visitors.
For instance, we figured out that almost 50% of users did not see the schedule block.
The block with reviews was at the bottom of the page and it was seen only by 11% of visitors.
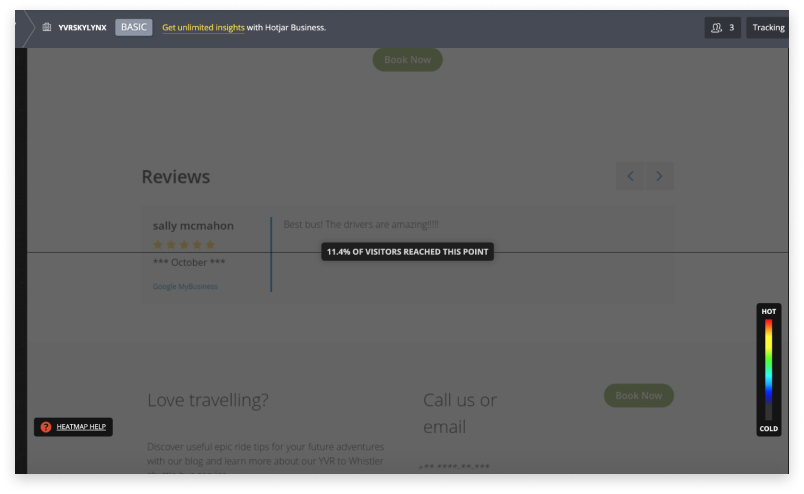
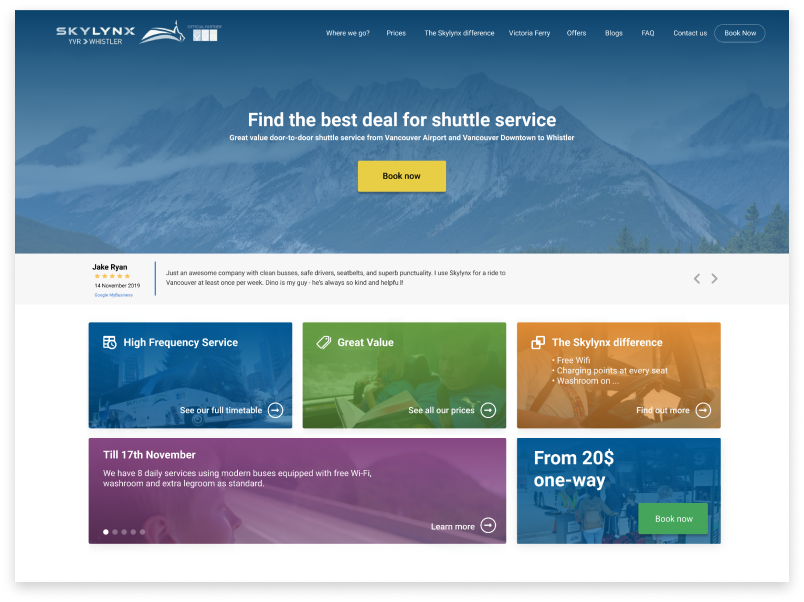
Based on this data we made changes to page layout:
First orders were made through referral campaigns and promotions at YVR airport. A little after, the company started an advertising campaign, but its effectiveness was not being monitored. To improve that, we set up end-to-end analytics which helped our clients keep track of turnover for each channel, average receipt, and, of course, the effectiveness of advertising campaigns.
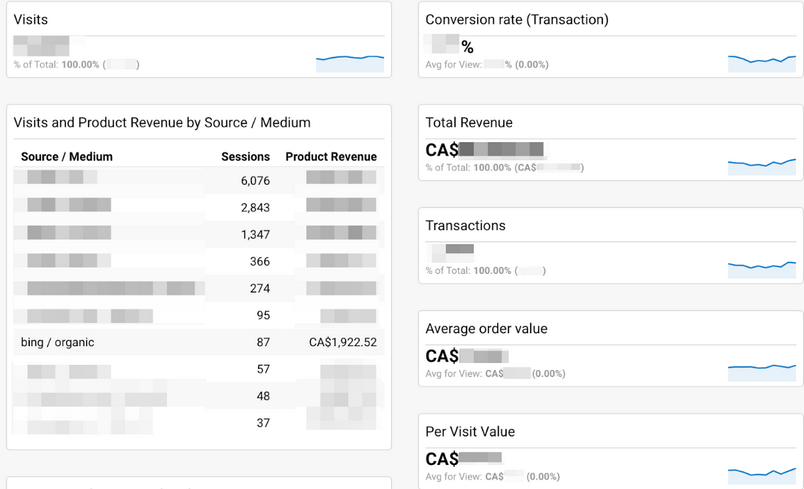
This screenshot demonstrates how many visits and product revenue were there for every single online channel. Additionally, we could see the conversion rate, total revenue, transactions, average order and per visit value.
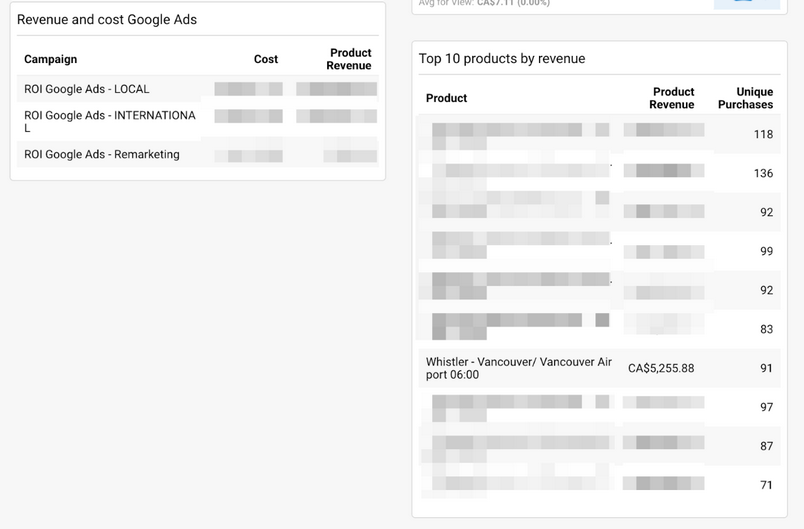
We could see advertising campaigns pulled from Google AdWords account as well as investments and turnover for each campaign. On top of that, it showed which company products were in the greatest demand among the clients.
Aside from the above-mentioned data, the implemented end-to-end analytics also helped to monitor the effectiveness of SEO activities.
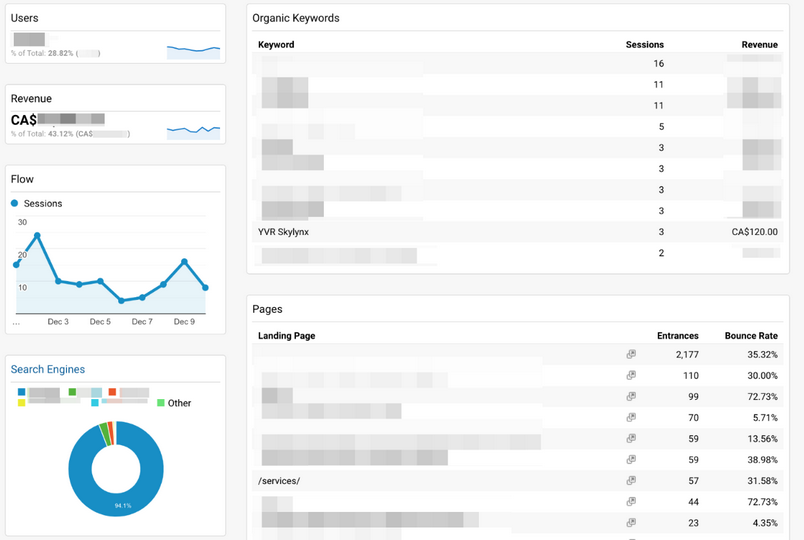
The screenshot displays the number of sessions from SEO traffic, how many sales the channel brought, the list of organic keywords used to visit the site, and pages the customers viewed. You can see the diagram demonstrating the distribution of visits from different search engines.
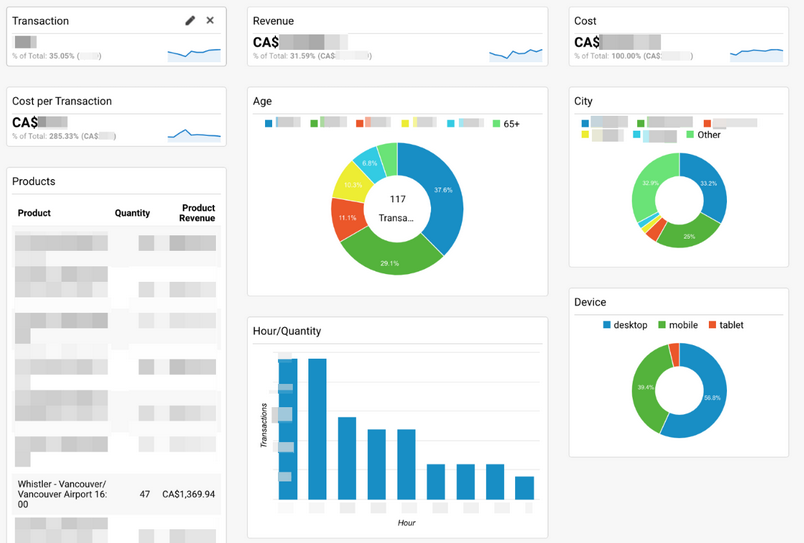
This is a more comprehensive report for contextual advertising. It displayed the popularity of resources among different age groups demonstrating what cities and devices were used to visit a website.
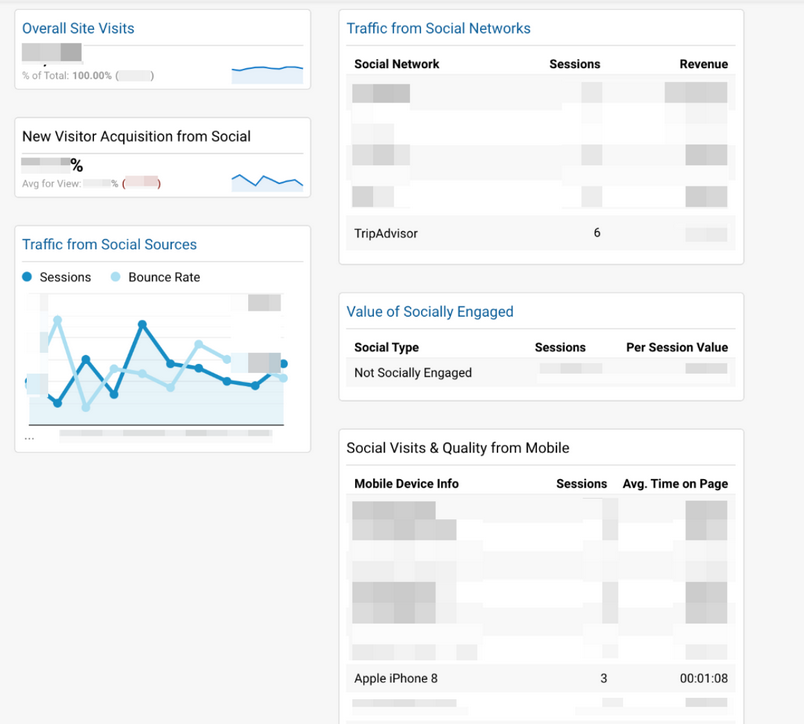
This report showcases the traffic from social media sources. In other words, we could see what social networks users were on before visiting the site and what devices they used.
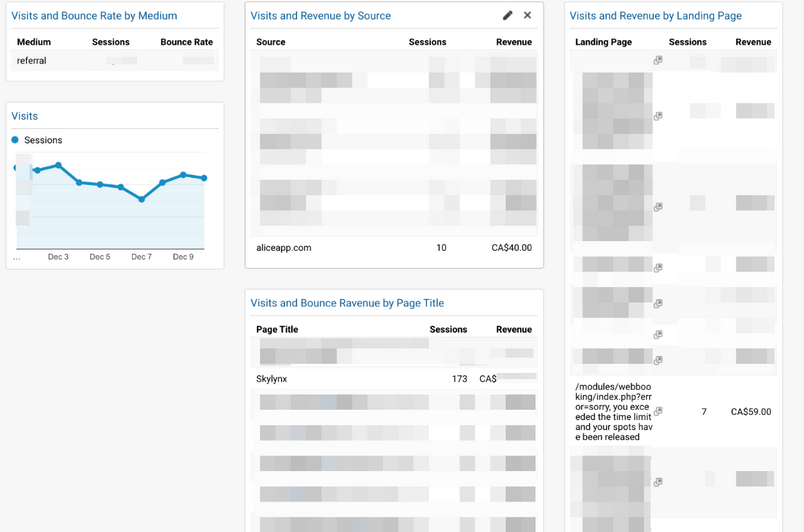
The company bought ads from different referral sources and had to understand the effectiveness of such investments. This specific report displayed the traffic driven from every single partner and what revenue is generated. It also helped to monitor what pages were the most popular in terms of advertising channels.
As a result, end-to-end analytics made it possible to analyze the effectiveness of the money invested in every single channel and budget marketing activities based on that collected, grouped, and analyzed data.
Business Analyst
Nikita Delyukov
Backend Developer
Alex Didyk
UX/UI designer
Phil Mishanin
Frontend developer
Petr Tsurkevych

We will get back in touch with you
If you require an NDA, we can provide one after an initial phone conversation.